This post has been created in collaboration with LambdaTest.
In this post, we will show how to set up TestNG tests in TeamCity and power them up with the LambdaTest signature Selenium Grid Cloud functionality. LambdaTest allows executing automated tests on over 2000+ browsers. This helps achieve quicker continuous integration and more stable delivery of products to consumers. With its interactive UI dashboard, you get detailed test reports, logs, and videos, which makes it easier to analyze and debug any product issues.
You can read more about the benefits of the TeamCity integration with LambdaTest in this post.
Prerequisites for the tutorial:
Maven and project-related dependencies are installed on your build agent machine.
You have a LambdaTest account. You will need a username and access key to integrate TeamCity with LambdaTest.
Configuring Selenium Grid test case
In the scope of the tutorial, we assume that you store the tests’ source code in a Git repository. The repository structure is a standard Maven project with tests and resources stored in the src/test folder and *.properties and pom.xml in the root folder.
Step 1. Inside the root folder, create the pom.xml file to describe the test run configuration and resolve dependencies.
This XML file will define all the required dependencies and plugins to run the test cases: TestNG dependencies, Selenium-Java to define web interactions, the Surefire plugin for reporting, and different profiles to define test run formats (such as single or parallel).
Step 2. Inside the root folder, create the Config.properties file to provide test run details and LambdaTest account credentials.
#Define the browser-related information to execute cases on LambdaTest Grid
browser=Internet Explorer
version=11.0
os=Windows 8.1
resolution=1024x768

#Lambdatest Credentials
LambdaTest_UserName=<YOUR_LT_USERNAME>
LambdaTest_AppKey=<YOUR_LT_ACCESS_KEY>
Step 3. Add the resources folder under src/test to store *.xml files for a single and parallel test configurations.
Example for a single test configuration: This XML file defines the class to be executed in case a single test is triggered.
Step 4. Add the tests folder to store the test case *.java files and a configuration file to fetch properties.
This configuration class file is to read and load the data related to the config properties from the Config.properties file so it can be accessed throughout the run. This data provides the LambdaTest account credentials to all instances during the execution.
Example test case for the configuration file:
package com.lambdatest.Tests;

import java.io.File;
import java.io.FileInputStream;
import java.io.FileNotFoundException;
import java.util.Properties;

public class Configuration {

    static String path = getFilePath();

    public static String readConfig(String key) throws Exception {
        String value = "";
        try {
            Properties prop = new Properties();
            File f = new File(path + "/Config.properties");  //To read the properties file
            System.out.println(path);
            if (f.exists()) {
                prop.load(new FileInputStream(f));
                value = prop.getProperty(key);       // to set all the property values to config
            } else {
                throw new Exception("File not found");
            }
        } catch (FileNotFoundException ex) {
            System.out.println("Failed to read from application.properties file.");
            throw ex;
        }
        if (value == null)
            throw new Exception("Key not found in properties file");
        return value;
    }

    public static String getFilePath() {
        String filepath = "";
        File file = new File("");
        String absolutePathOfFirstFile = file.getAbsolutePath();
        filepath = absolutePathOfFirstFile.replaceAll("\\\\+", "/");
        return filepath;
    }
}
See the test case for a single test execution. This Java test class file loads all the required details for the test execution on LambdaTest Grid and provides relevant information to execute the test case in a single mode.
See the test case for a parallel test execution. This Java test class file loads all the required details for the test execution on LambdaTest Grid and provides relevant information to execute the test case in a parallel mode.
Configuring project in TeamCity
Create a new project in TeamCity. Its VCS root should point to the Git repository where the code of the Selenium test cases is stored.
Create a new build configuration inside this project. Attach it to the project’s VCS root.
Add the Maven build step. The Maven build runner supports the TestNG framework and provides real-time reports. In addition to those, the LambdaTest dashboard will provide informative logs and video recordings. To configure this step in your build configuration, refer to our documentation.
To execute the test over LambdaTest Grid:
For a single test execution, set the test goal and add -P single as an additional command-line parameter.
For a parallel test execution, set the test goal and add mvn test -P parallel as an additional command-line parameter.
Set up additional build steps if necessary.
On the Build Configuration Settings | Parameters tab, add environment variables with values for your LambdaTest username (LT_USERNAME) and access token (LT_ACCESS_KEY). You can find them on your LambdaTest profile page. Values of these credentials will replace those specified in the LambdaTest Selenium Cloud Grid configuration files.
As the integration setup is completed, click Run to start a build. The build log will show that your build is being executed by LambdaTest.
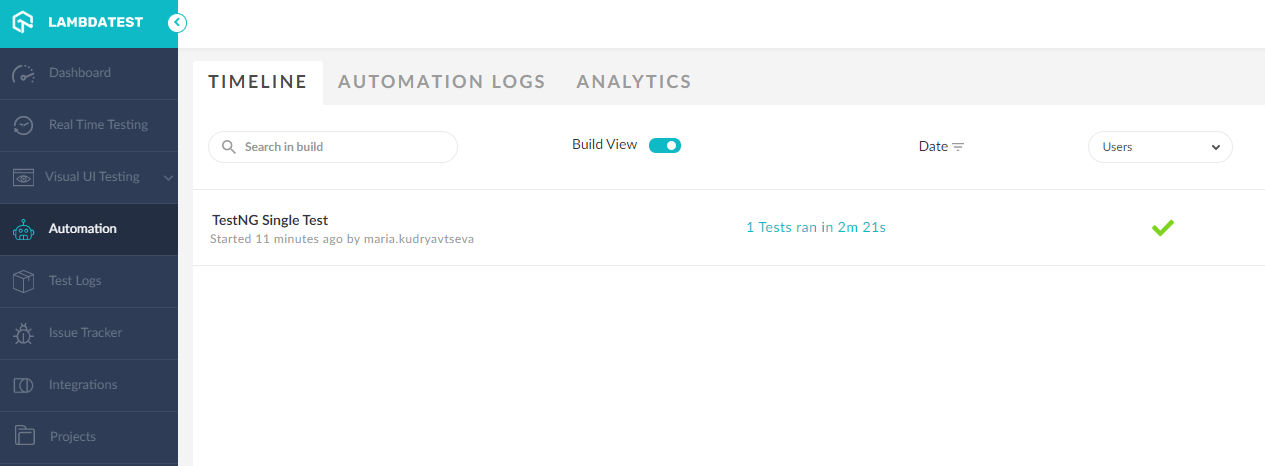
On the Automation tab of your LambdaTest dashboard, you can see that the test is completed and explore it in details.
Analyzing Build Results with LambdaTest Dashboard
After having completed the TeamCity setup and integration with LambdaTest and executed the build, you can analyze all the build-related information like timelines, scripts, videos, and logs. You can even report the bugs directly from LambdaTest to any supported project management tool.
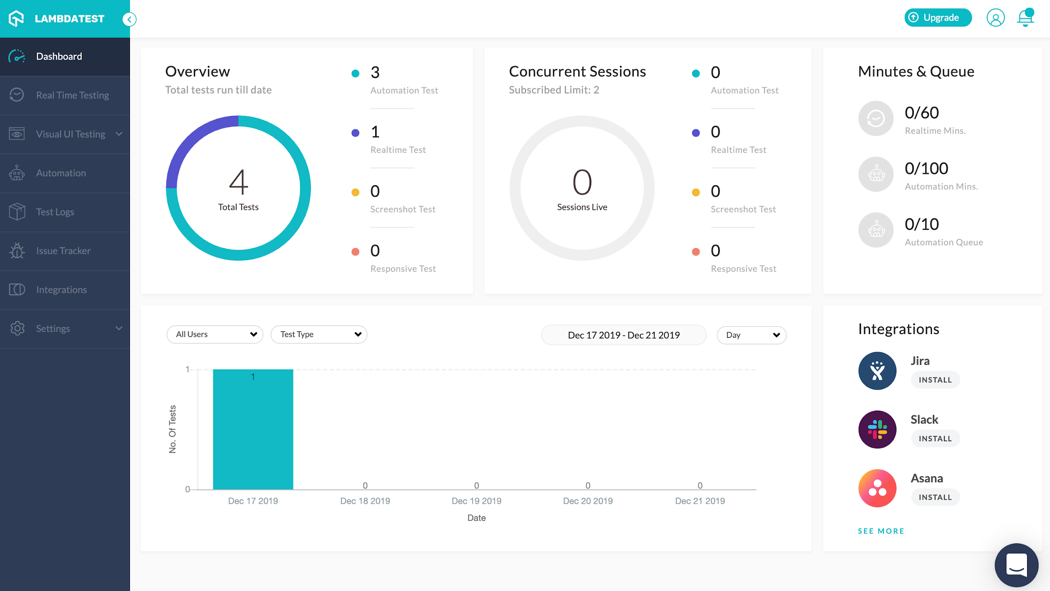
As you login to LambdaTest, you get redirected to the dashboard which gives the real-time overview of test runs executed so far (numbers, dates, graphs, and so on).
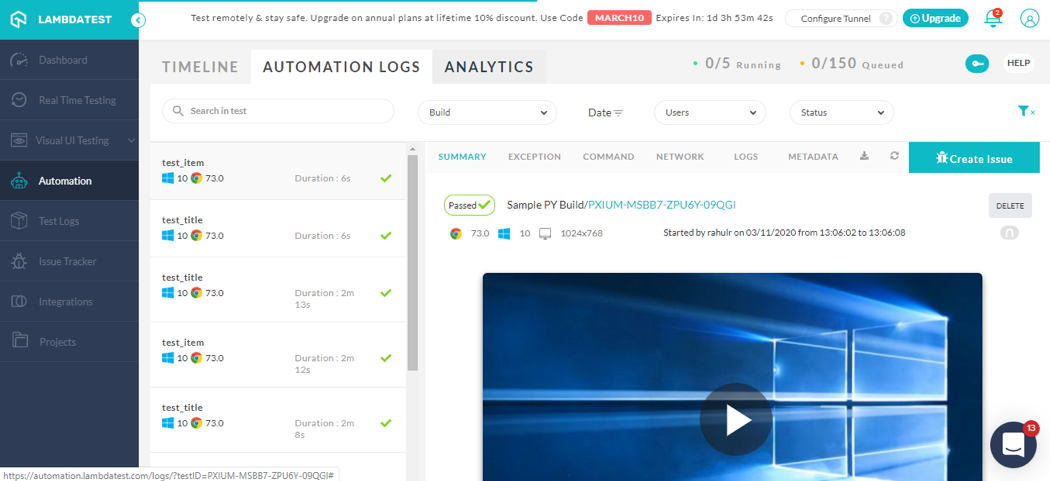
All the details about the Selenium test execution can be found in the Automation tab. It provides a variety of test logs including network, exception, and command logs. You will also have access to a video recording of your entire Selenium test execution, along with command-by-command screenshots.
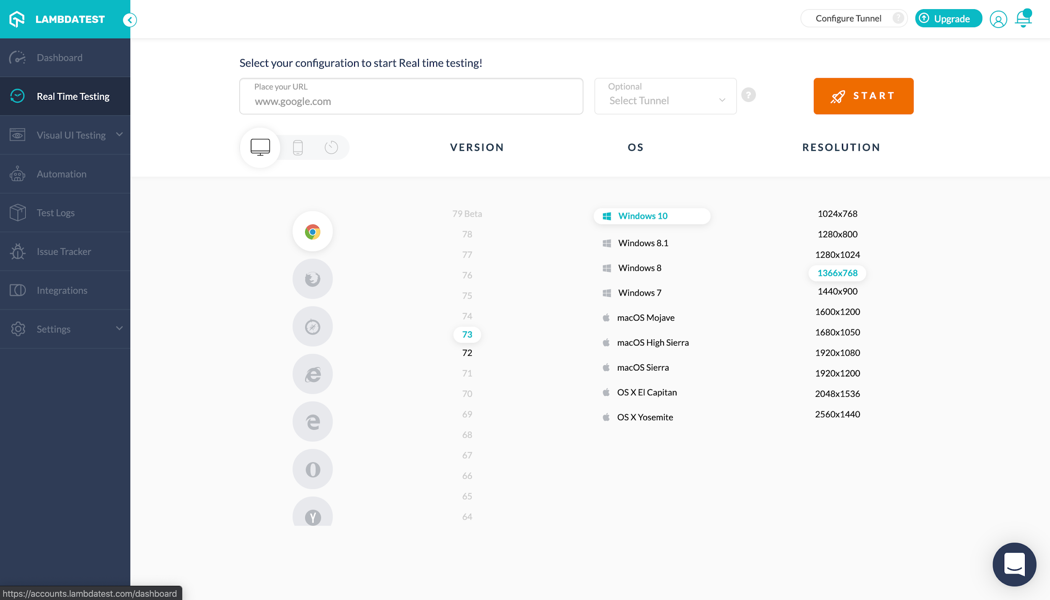
Other than Selenium test automation, LambdaTest helps with live-interactive testing, screenshot testing, responsive testing, and visual regression testing.
The Real Time Testing panel provides you the freedom to execute the test cases over 2000+ browsers with different combinations of browser/version/OS/resolution to serve all user needs.
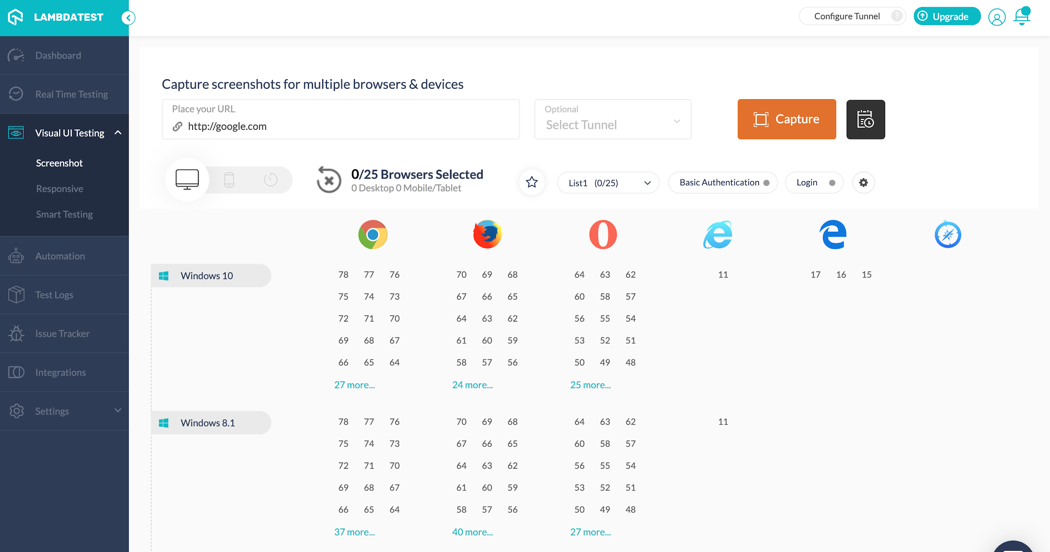
Under Visual UI Testing, you can easily run and compare screenshots on a wide combination of OS’s and browsers to explore the differences.
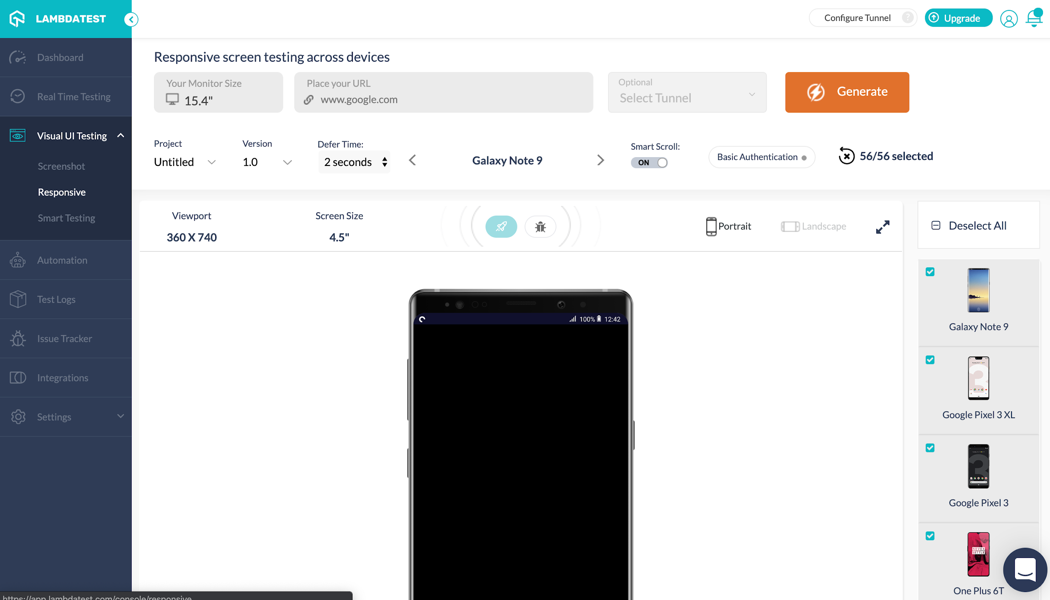
You can test across different screen sizes and resolutions to check for responsiveness of the nature of the changes.
Another advantage of choosing LambdaTest Cloud Grid is the range and variety of logs it provides. It captures logs in form of videos, screenshots, networks logs, and filters them for better analysis and thus facilitates troubleshooting.
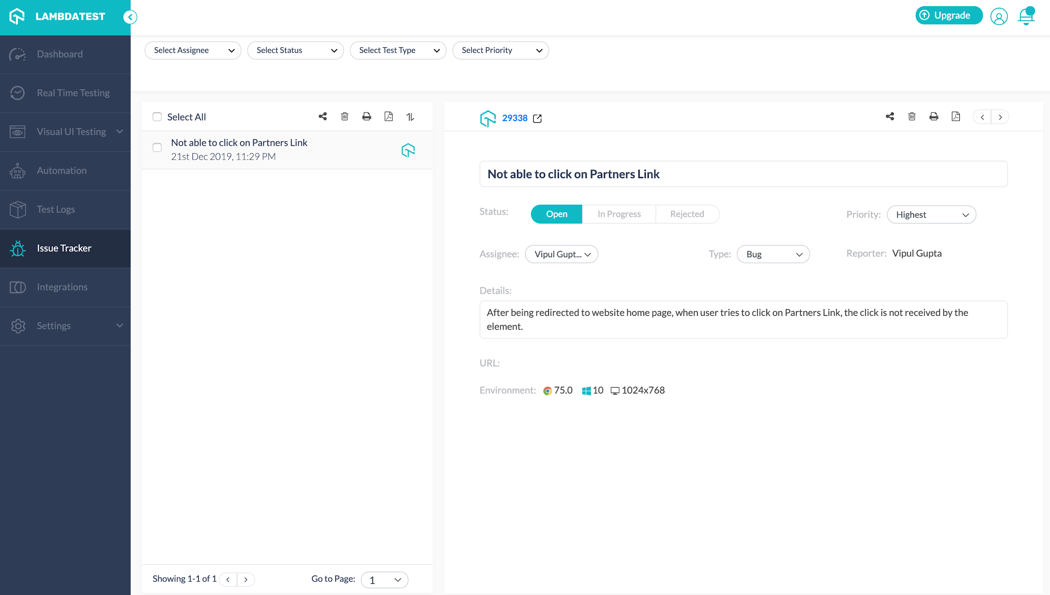
You can also track issues or bugs at the time of their occurrence during the run and add them in the Issue Tracker to share with the team.
Summing Up
With this tutorial, we explained why and how to integrate TeamCity with LambdaTest to make the development lifecycle easier and provide a faster shipping of products to the market. We’ve learnt how to perform the Selenium testing, configure the integration on the TeamCity server, and execute builds on LambdaTest Selenium Cloud Grid.
Now, you can get started with integrating your own TeamCity projects and achieving your own goals with the powerful LambdaTest toolkit.
This post was created in collaboration with a TeamCity .NET developer Nikolay Pianikov.
Microsoft has recently released .NET 5, a new SDK that unifies all the modern .NET tools. In anticipation of this, we have revised our integration with .NET in a new build runner that has been available since TeamCity 2019.2.3.
In this blog series, we’ll tell you about this new integration and take you through a demo project you can run on your server.
Old approach vs. new approach
If you’ve worked with .NET in TeamCity before, you’ll already know that the variety of integration tools it provides can be pretty overwhelming. As Microsoft strives to combine all .NET functionality together into one SDK, we have also decided to streamline our approach to building .NET projects.
Previously, TeamCity offered the following .NET components:
Most of the listed runners are now represented by a single .NET runner. This makes it much easier to compose your build projects and test them on multiple OSs using one transparent solution. The new runner supports:
We are still supporting the obsolete runners to give our users enough time to migrate. But, this support is limited and we are not going to be adding any new features to these runners. If you have not migrated yet, check out the .NET runner documentation for instructions. If you have any trouble migrating, please leave a comment or let us know about it via one of our feedback channels.
Demo project
To illustrate the new approach, we’ve created a demo project. In Part 1, we will describe its structure. For more details and helpful tips, keep an eye out for the next parts of this blog series. If you’d like to follow along, you can clone the demo repository and run this project yourself.
To configure CI/CD for this source project, we’ve designed a hierarchy of projects and build configurations in TeamCity.
Though TeamCity has a friendly UI, we prefer to keep all configurations in Kotlin DSL. This way, it is easy to version project settings and reuse them. For example, you can just fork our demo source code and Create a project from its URL on your TeamCity server. There is no need to set up anything manually.
If you are curious about how to create configurations as a code, we recommend reading this blog series.
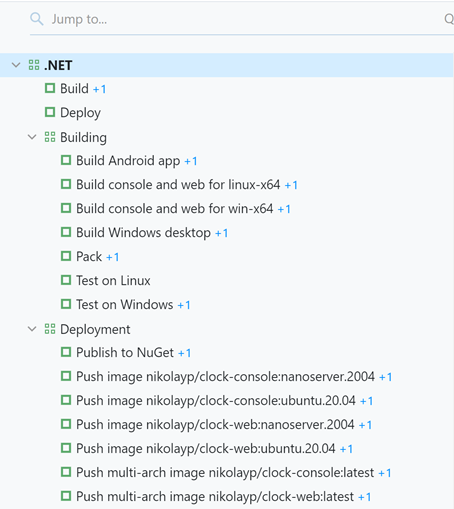
The root demo project in TeamCity comprises two build configurations and two subprojects.
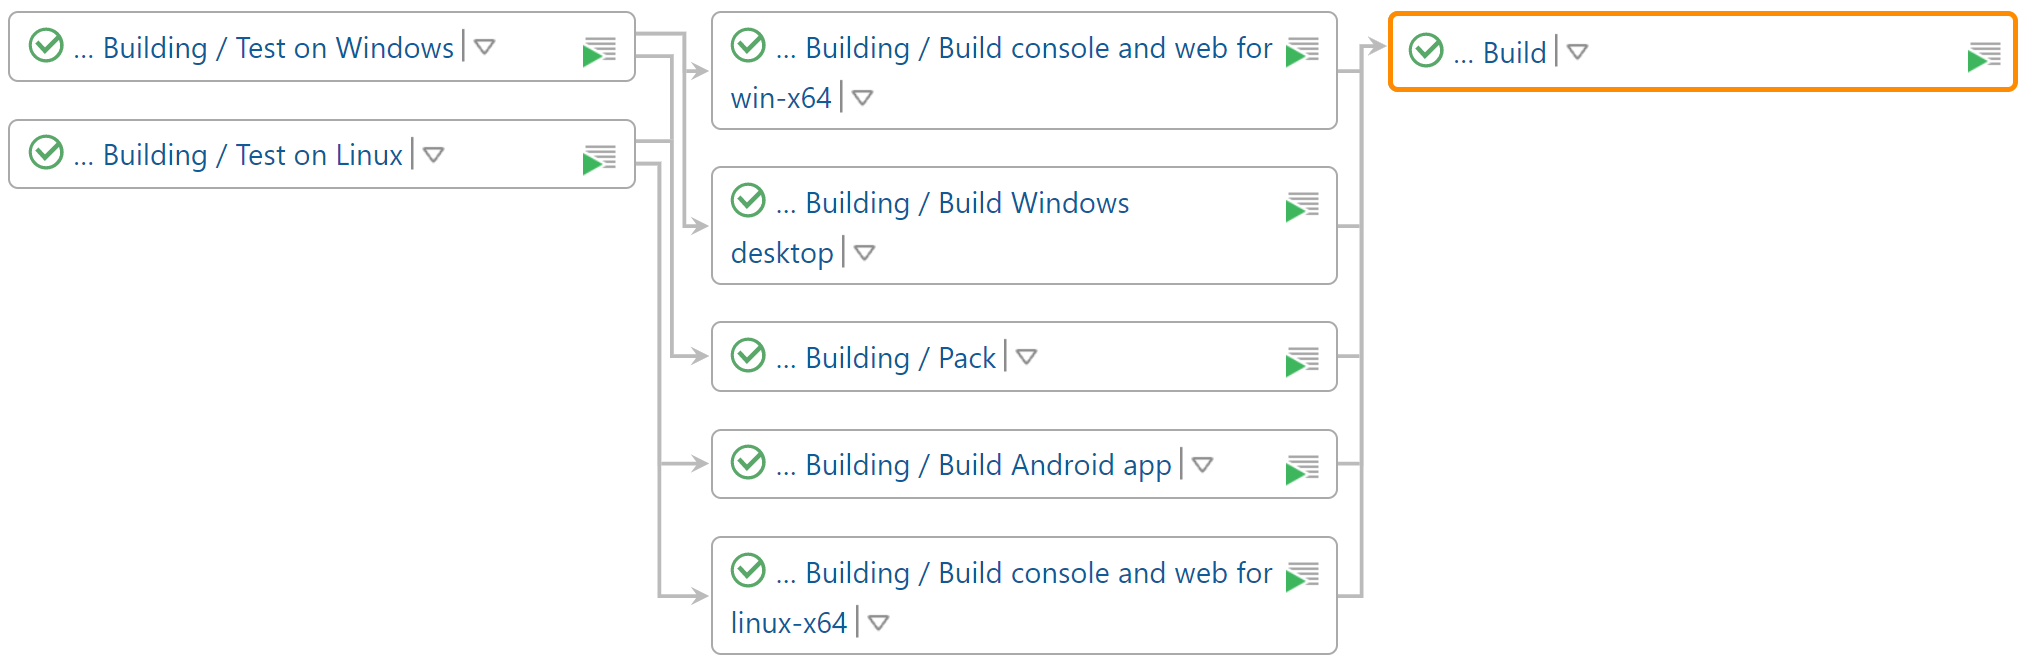
The "Build" configuration aggregates apps and packages from configurations of the "Building" subproject:
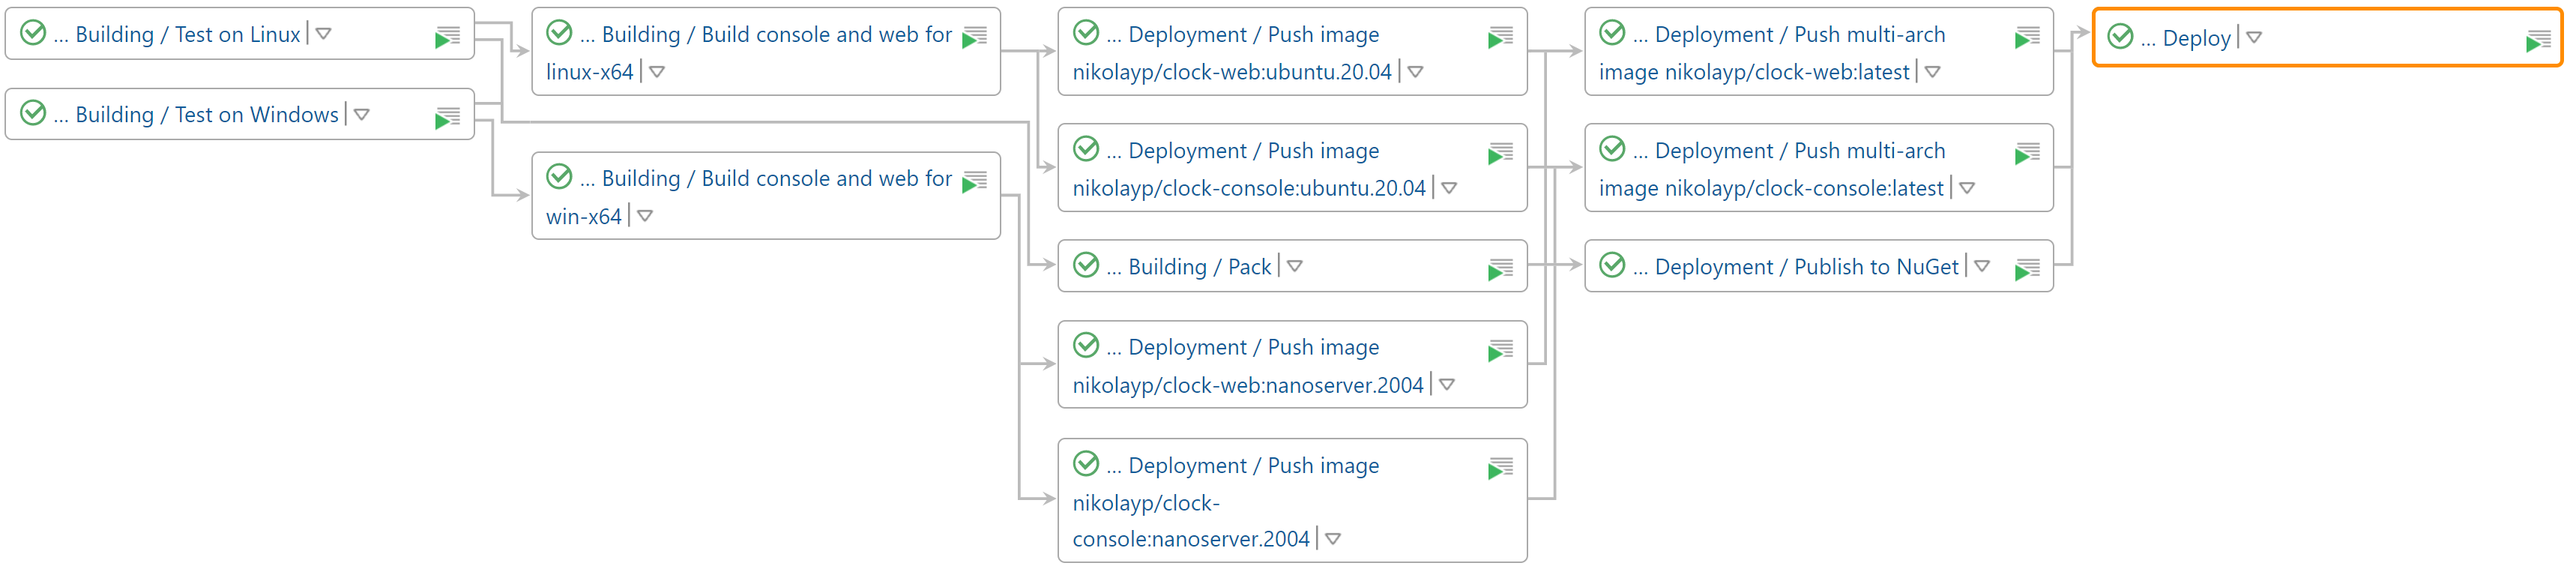
The "Deploy" configuration, predictably, deploys them into Docker and NuGet repositories:
This way, we build a hierarchy of configurations, each of which serves its granular purpose: one for testing on Linux, one for building an Android app, and so on.
All these configurations use system parameters that are passed to .NET commands as key-value pairs: /p:key=value. For example, if a build configuration has the system.configuration=Release system parameter, each launched .NET command will be run with the /p:configuration=Release parameter. The prefix system. will be omitted as it is only needed to indicate the parameter type in TeamCity.
Here’s the list of all parameters used in the build configurations:
You can include these parameters directly in project files or pass them via command-line parameters. By using system parameters, you don't have to worry about the nuances of passing special characters as TeamCity will take care of all of it.
To run these configurations, we used the following build agents:
Windows 10 x64 Pro 10.0.19041
Visual Studio 2019 Pro 16.7.5
Docker (Windows container) 19.03.13
.NET SDK 5.0
Ubuntu 16.04
Docker 18.06.3
This was just the general structure of our demo project. In the next part of this series, we will talk about its build and test configurations in more detail. Meanwhile, you can explore this project yourself or read the .NET runner documentation.
Once again, your feedback is very important to us. Please let us know if you like the new .NET runner and what you expect from it in the future.
In this blog series, we talk about the new approach we use to integrate TeamCity with .NET. Part 1 describes the .NET runner, that covers most of the core integration functionality, and introduces a demo project. In Part 2, we will dig deeper into the demo project and explore its Test and Build configurations.
To run all build configurations, we use the following agents:
(A) Windows 10 x64 Pro 10.0.19041
Visual Studio 2019 Pro 16.7.5
Docker (Windows container) 19.03.13
.NET SDK 5.0
(B) Ubuntu 16.04
Docker 18.06.3
Cross-platform testing
As described in Part 1, the demo project contains two build configurations that provide cross-platform testing of our app.
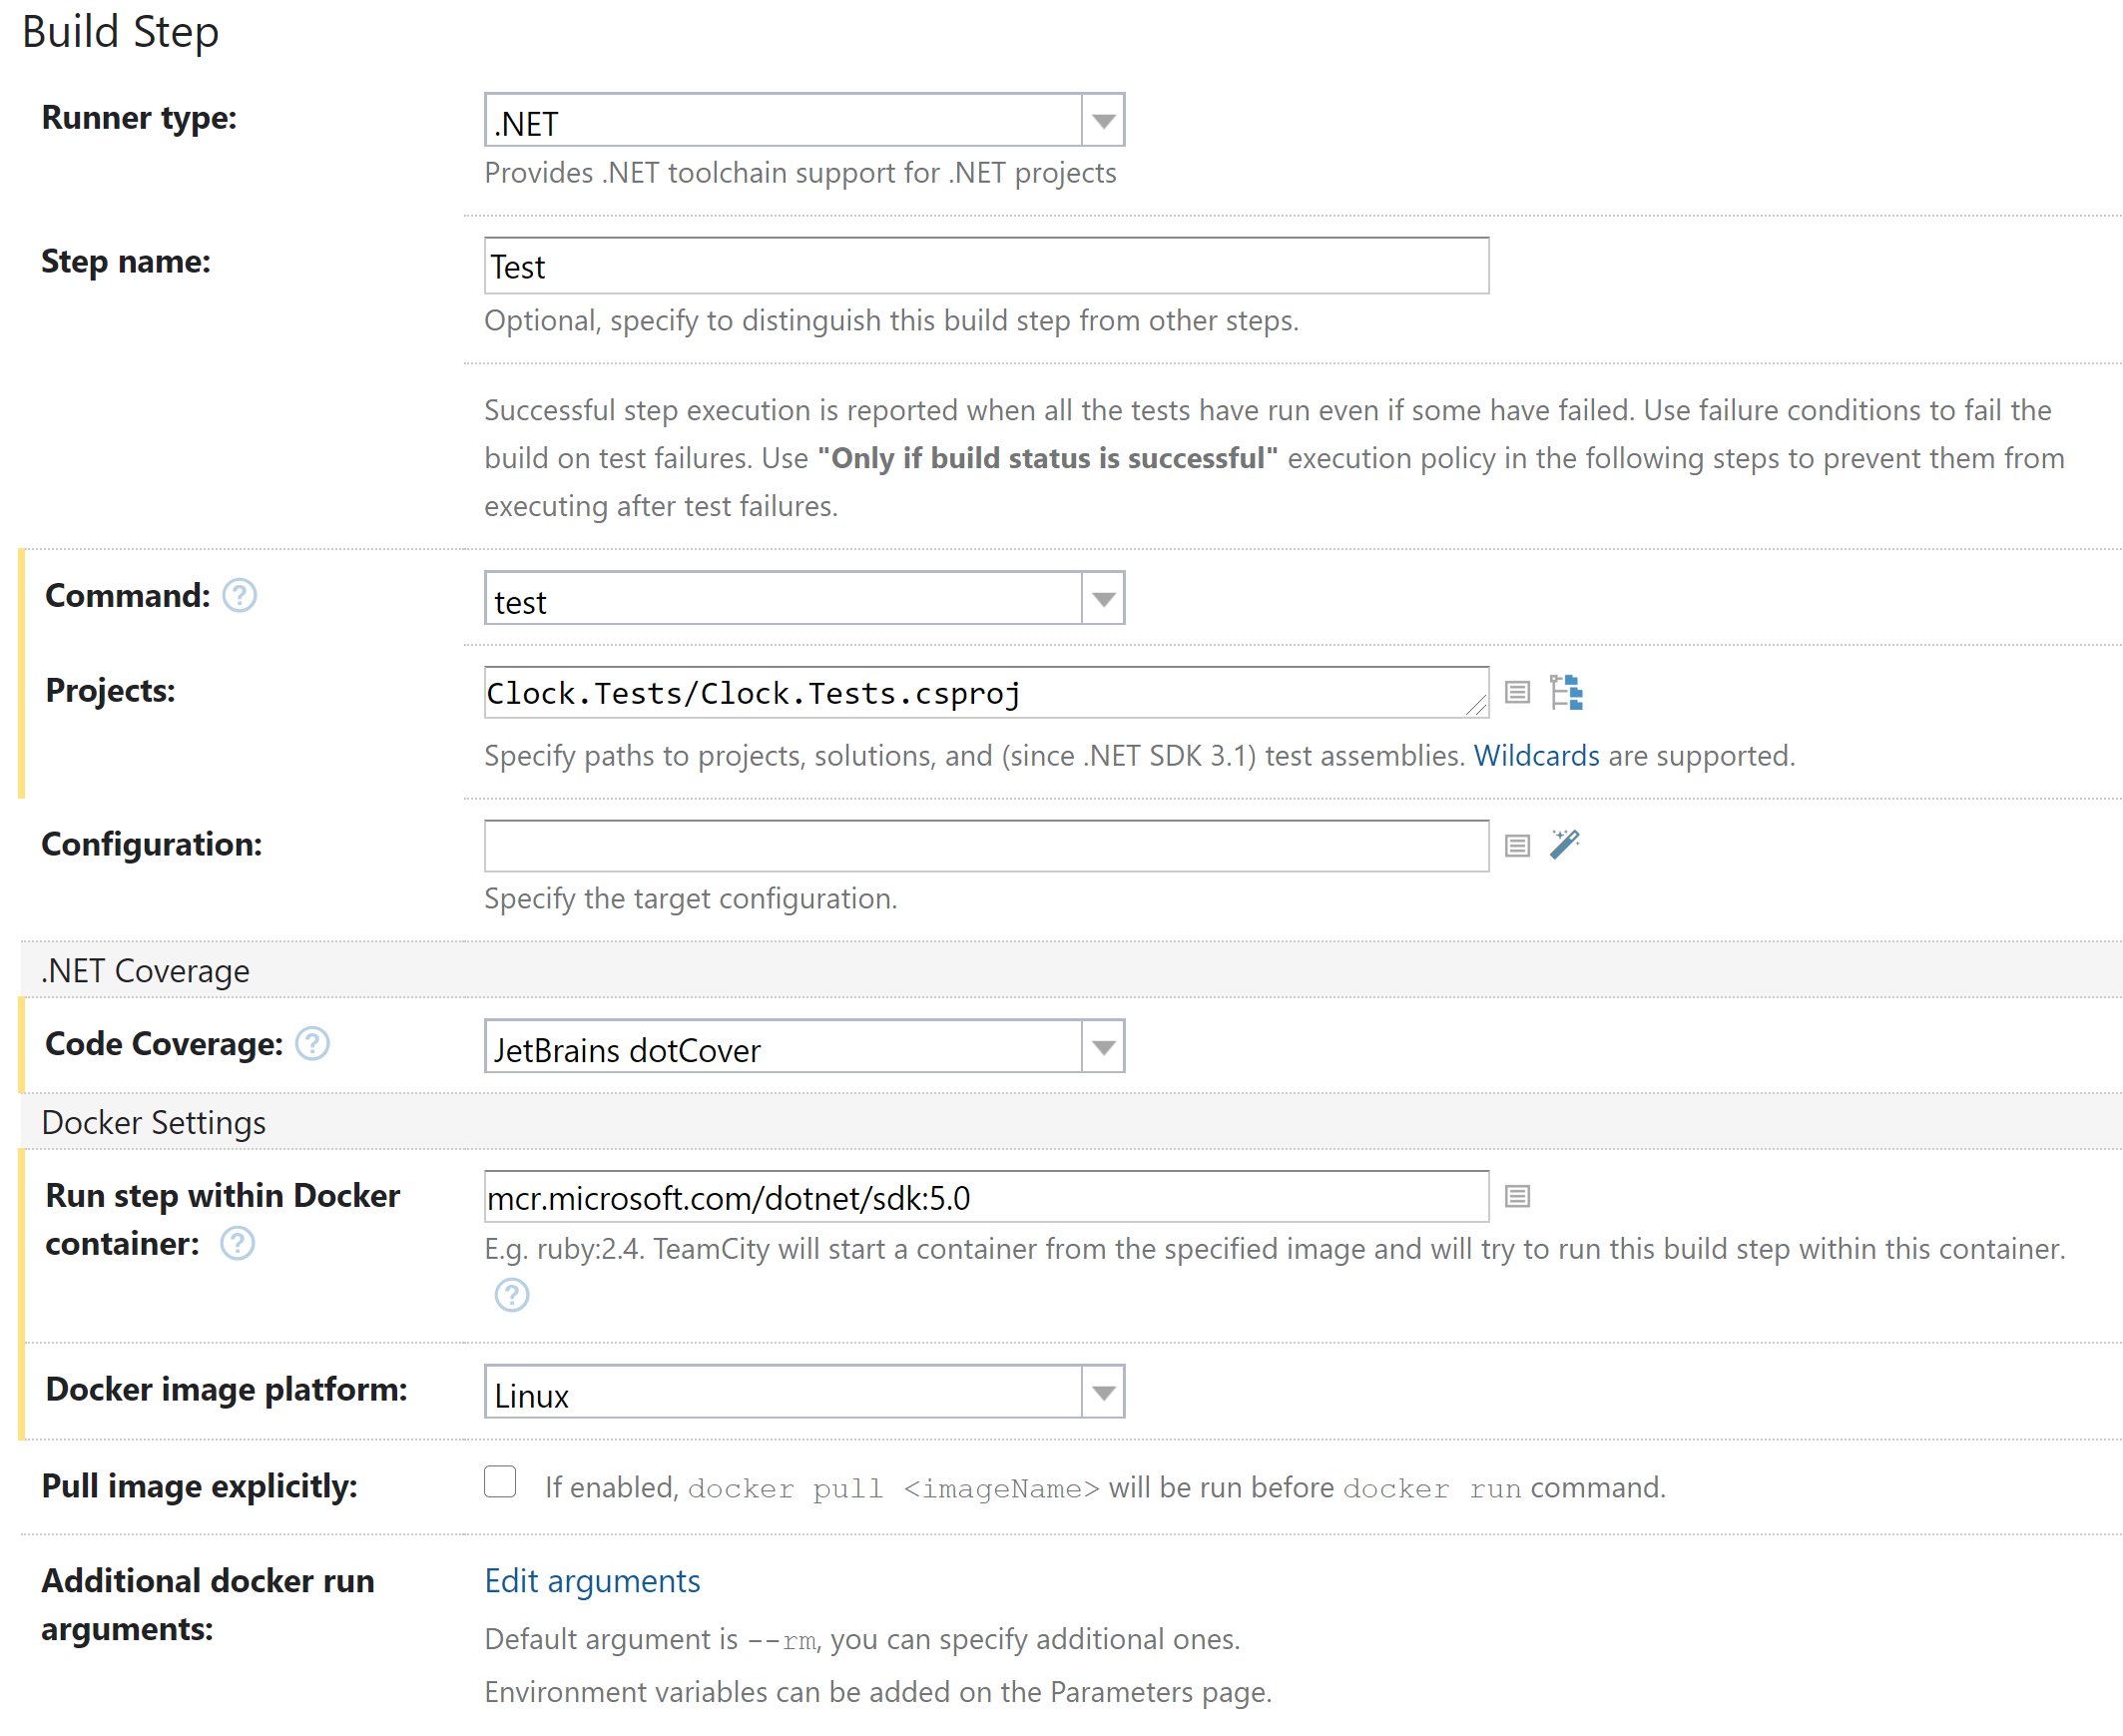
These build configs, "Test on Windows" and "Test on Linux", test the app’s basic logic and collect code coverage statistics on Windows (agent A) and in a Linux Docker container .NET SDK (agent B), using a single .NET step. For example, in a Linux configuration, this step looks like this:
For Linux, the app’s libraries are tested inside the .NET SDK 5.0 container. In the Windows configuration, the step looks similar but doesn’t use Docker.
Our source subproject Clock.Tests is a .NET 5.0 application, so we can simply use the test command to run the tests. To collect and analyze code coverage statistics, we’ve selected JetBrains dotCover. It is automatically installed from the JetBrains.dotCover.DotNetCliTool package as an agent tool.
In the DSL, you can find both Linux and Windows test configurations under a common parent, TestBase.
Building console and web apps
As is clear from their names, the "Build console and web for win-x64" and "Build console and web for linux-x64" configurations are responsible for building two versions of the app from two source subprojects: Clock.Console and Clock.Web. Each configuration comprises two steps, one for each version of the app.
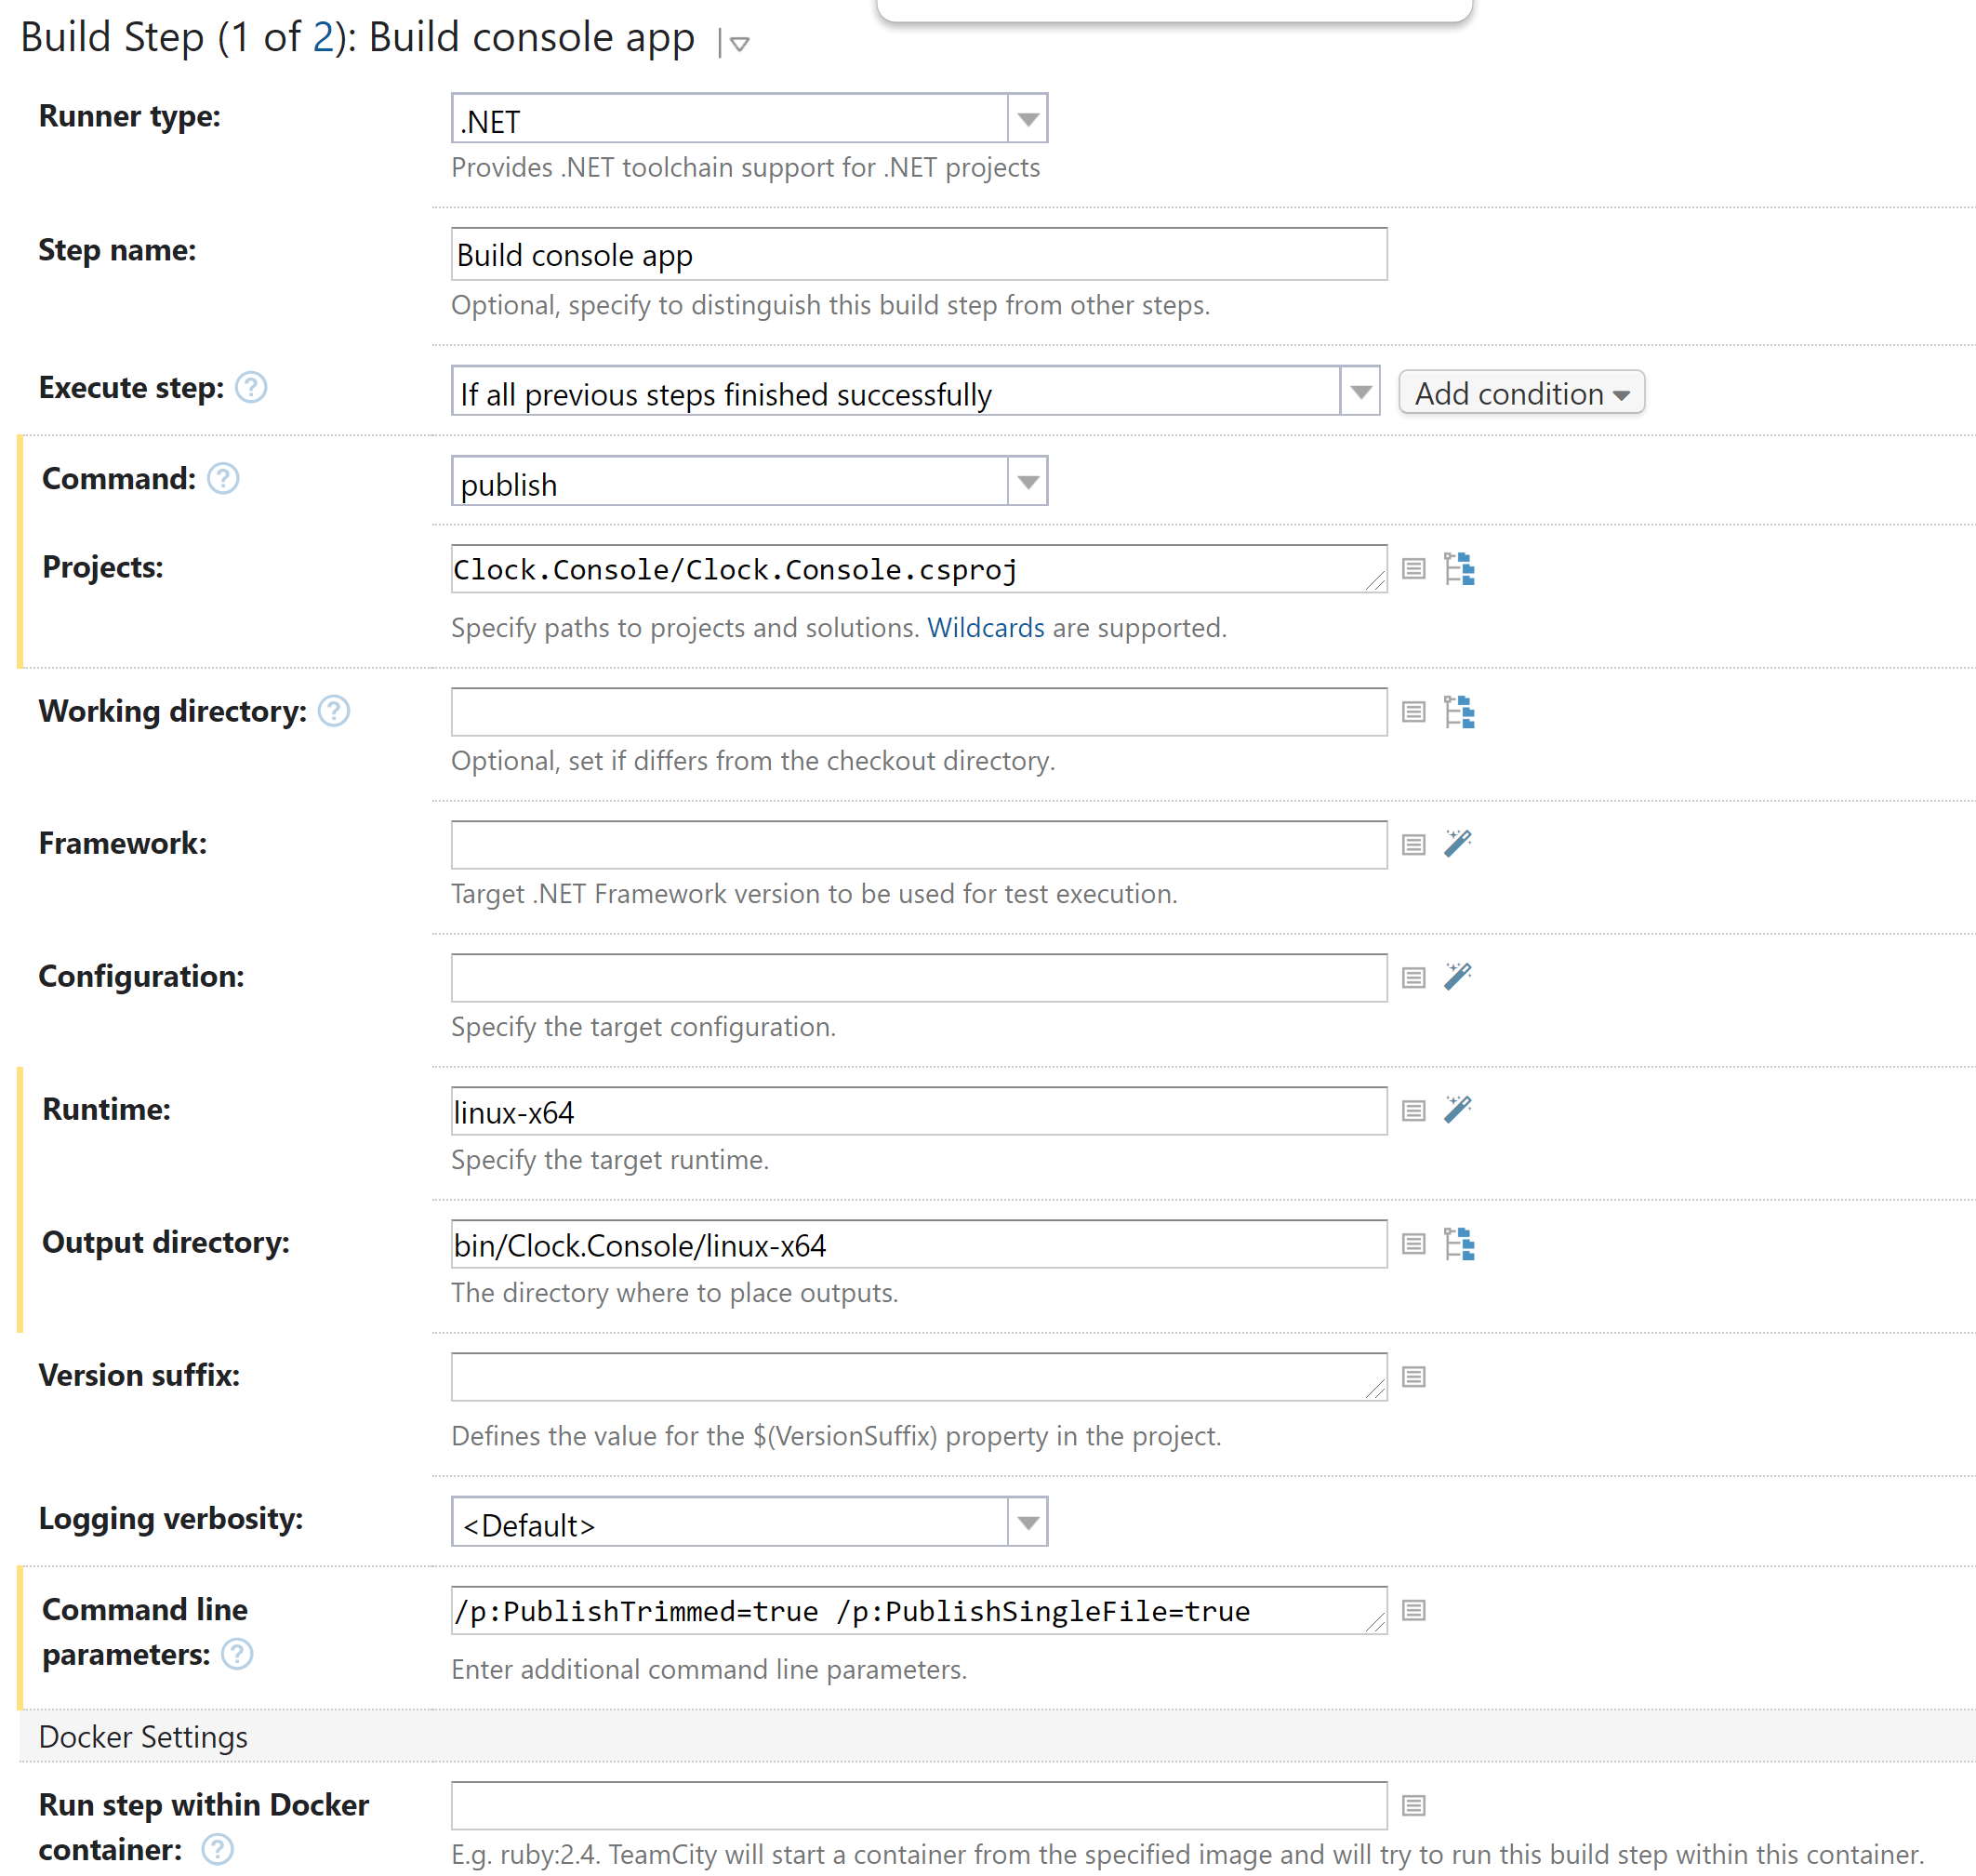
Clock.Console and Clock.Web are .NET 5.0 applications as well, so we can build and publish them using a single .NET Core CLI command – publish. Here is the example first step on Linux:
It builds and publishes the console Clock app into a single executable under the bin/Clock.Console/linux-x64 directory.
On Windows, this step has different values for the Runtime (win-x64) and Output directory fields (bin/Clock.Console/win-x64).
The second step builds and publishes the web version of the app. It uses a different project path and output directory.
After completing the two steps of each configuration, TeamCity publishes two resulting apps as build artifacts under the specified output directory.
In the DSL, these configs are inherited from the BuildConsoleAndWebBase class, which is inherited from BuildBase – the base class for all building configurations. We could have merged the two steps into one by declaring both subprojects in projects, but that would make it difficult to set apart binary files for the two apps. Now it is easily done with the help of the outputDir property.
Building Windows app
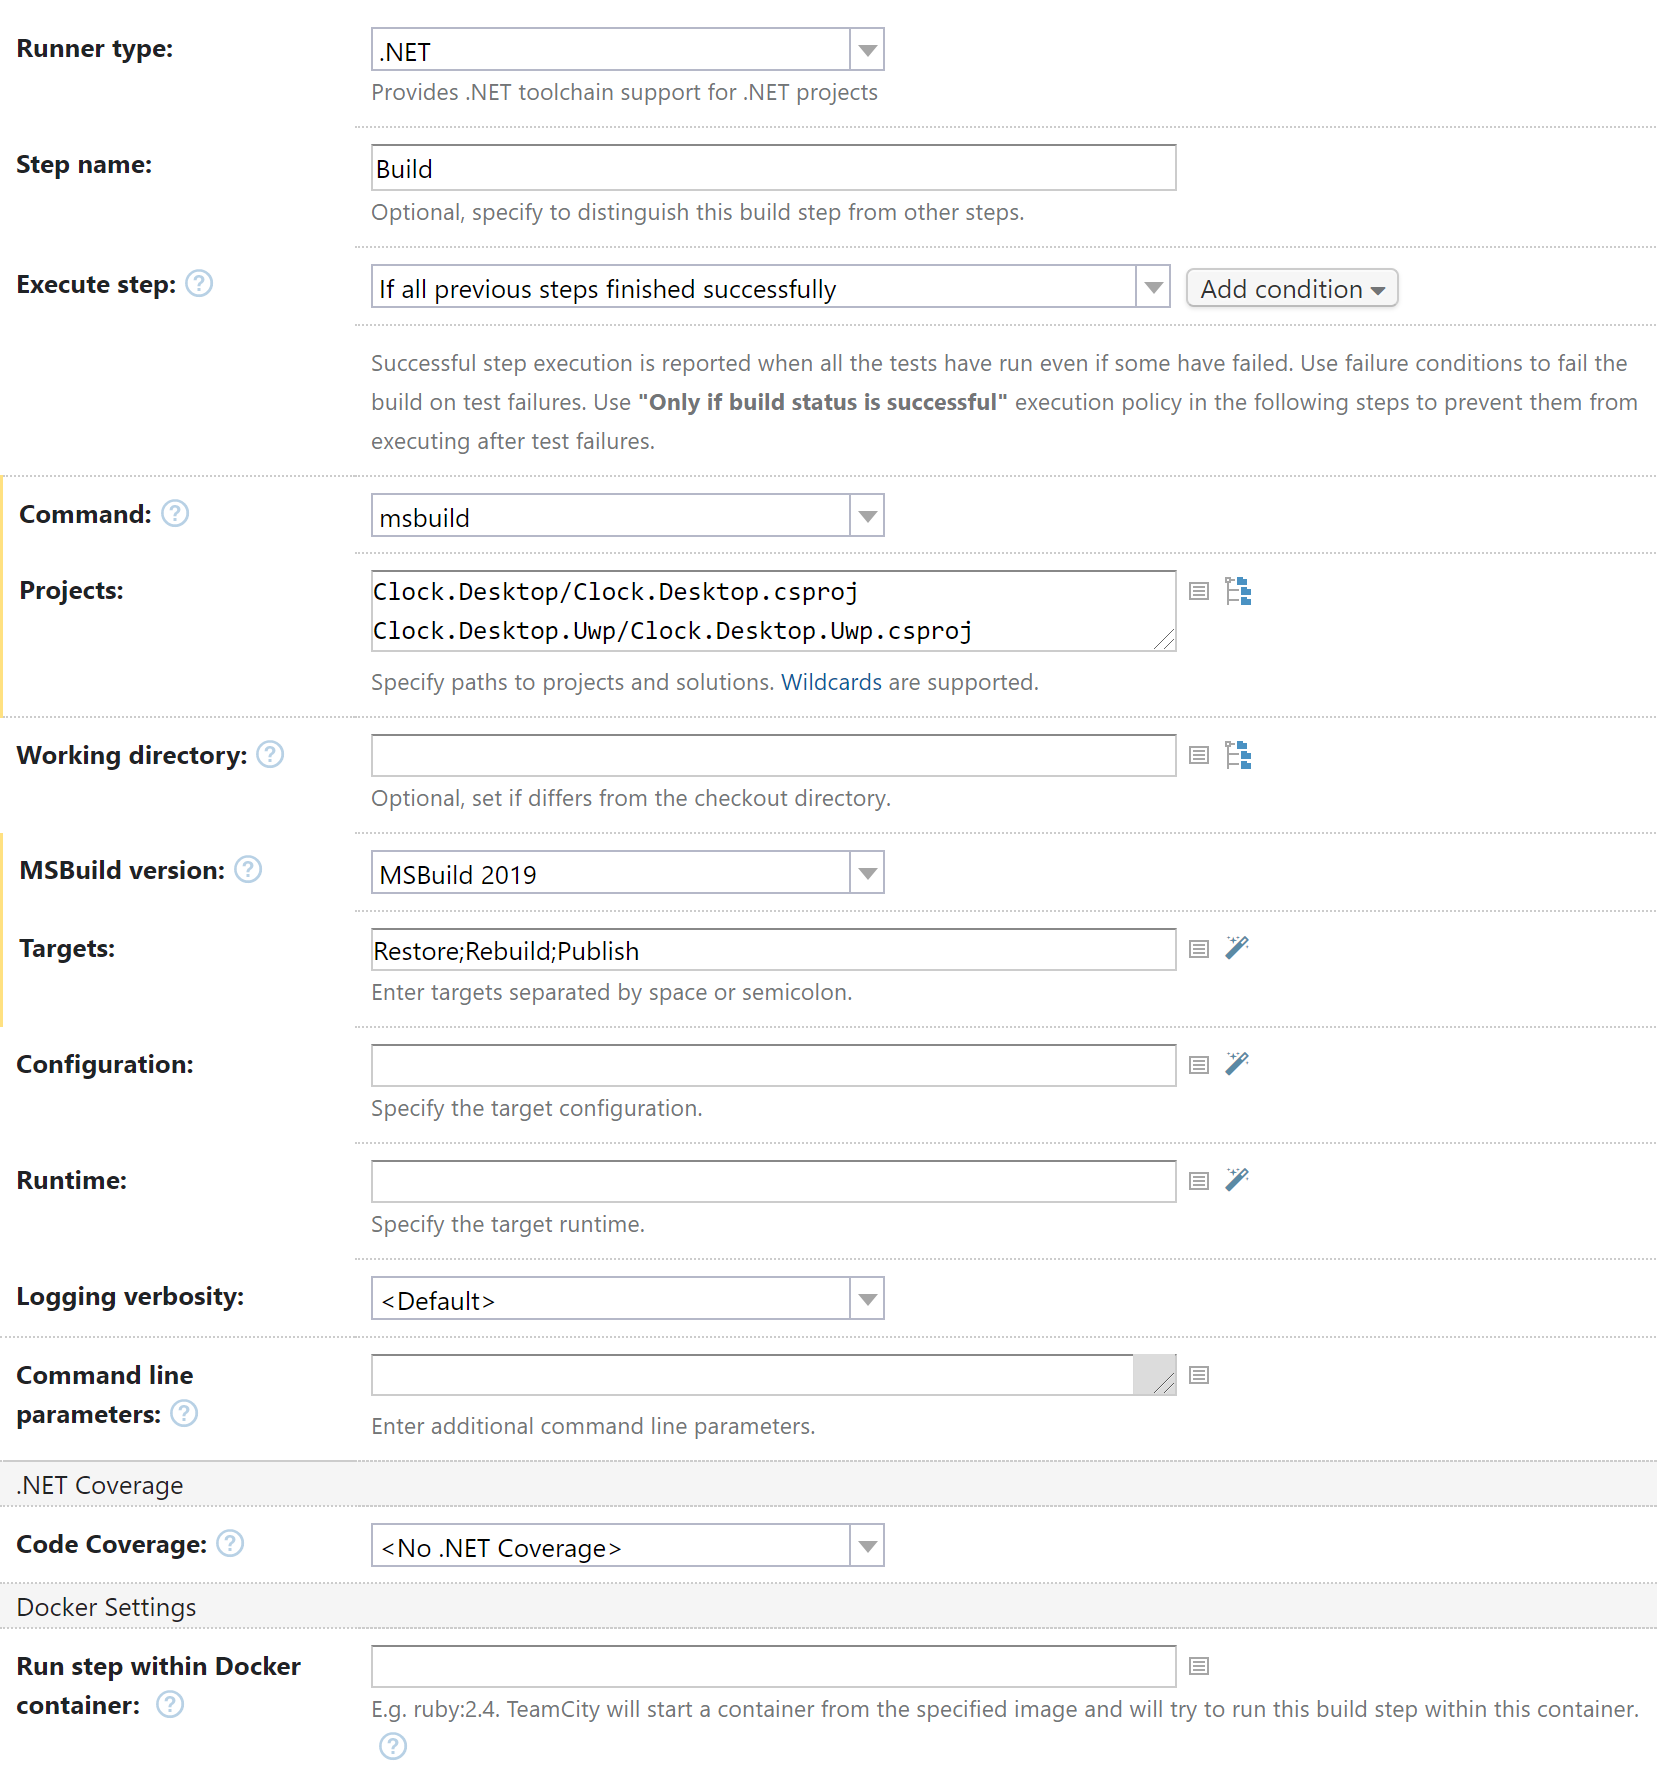
Our project can also build a desktop version of the app for Windows. The "Build Windows desktop" configuration has only one step:
It runs MSBuild from Visual Studio 2019, which is installed on agent A, and consequently executes the required targets for two subprojects:
Clock.Desktop/Clock.Desktop.csproj
Clock.Desktop.Uwp/Clock.Desktop.csproj
The results are published into two different directories that are specified in the system parameters: PublishDir (for Clock.Desktop) and AppxPackageDir (for Clock.Desktop.Uwp). These directories then appear in the build results as the build artifacts.
Building Android app
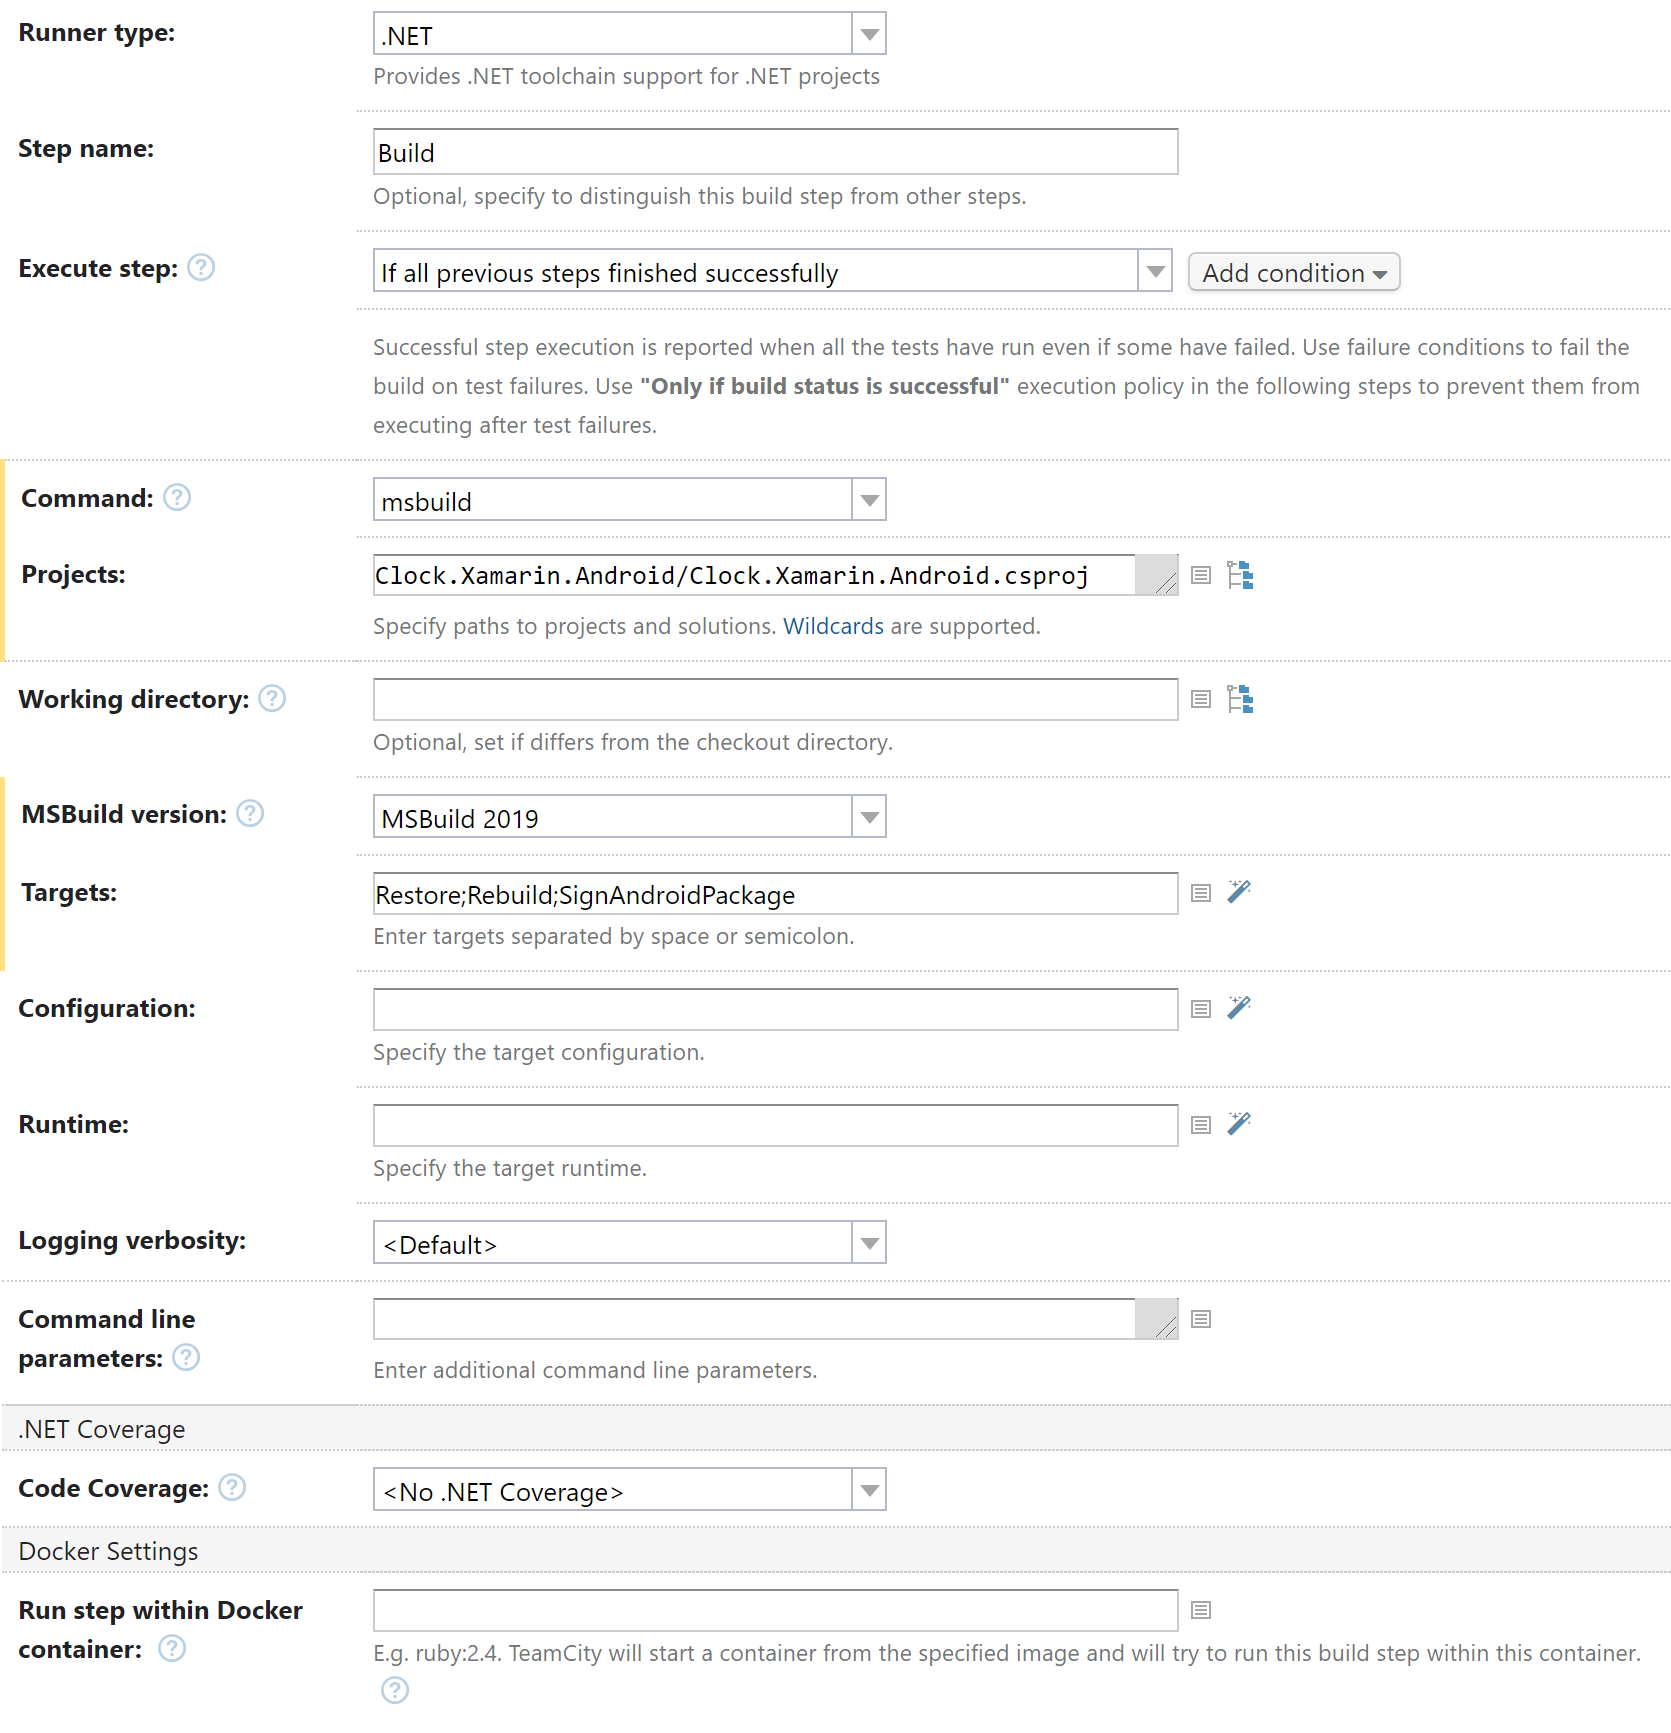
The "Build Android App" configuration builds the Clock app for the Android platform. Like the Windows configuration, it uses MSBuild from Visual Studio 2019 installed on agent A:
This config has only one step, and it is similar to the one on Windows. However, we use SignAndroidPackage instead of the Publish target because we need to publish a signed Android package.
That concludes the second part of our series. As you can see, building projects with our .NET runner is now more transparent than ever.
In the final part of this series, we will show how we pack, aggregate, and deploy our multi-platform app.
Your feedback is very important to us. If you’ve tried the new runner, please let us know about your experience and expectations.
TeamCity REST API is a powerful tool which lets you integrate external applications with the TeamCity server and create diverse script interactions. To make this instrument more useful and easier to understand, we have reworked the REST API documentation.
Compared to a general guide we had in the past, the new documentation provides more details and offers better navigation between sections. For beginners, it offers a quick start guide and describes common use cases. We plan to describe more popular cases and explore advanced topics in the future.
Experienced users will appreciate the full reference on API models, methods, and locators. It is automatically generated based on the source code of the most recent REST API version.
As this documentation is a work in progress, we will be glad to receive your feedback. Leave a comment to this post or use the "Was this page helpful?" widget at the bottom of each documentation page.
For now, we kept the previous REST API guide as is. If you find it more convenient, you can continue using it, though we encourage you to try the new docs.
We hope you enjoy using the new REST API documentation!
Today we are wrapping up our .NET integration demo. In this series, we’ve been explaining how TeamCity can integrate with .NET and walking you through a tutorial. To catch up with the demo, read the previous posts:
This project has already been built on the demo TeamCity server. You can sign in as a guest and explore the build results. Or, fork the source repo and build the project yourself.
After we tested and built our applications for different platforms, we can finally pack and deploy them!
Creating NuGet packages
The "Pack" build configuration has only one .NET step:
It executes the pack command to create NuGet packages for Clock and Clock.IoC projects. These projects are responsible for implementing the common logic for all apps.
You might remember that we specified all metadata of these packages, such as name or repository type, via system parameters of the "Pack" configuration. See Part 1 for details.
A successful "Pack" build produces NuGet packages as build artifacts. We will send these packages to a repository on the deployment stage.
Collecting artifacts
The high-level "Build" configuration is a special one: it has zero steps but multiple artifact dependencies on other configurations. This is just a little trick to bring all their artifacts together in one location:
Deploying apps and packages
Finally, it’s time to deploy. The high-level "Deploy" configuration doesn’t have any steps as well. But, it has several dependencies on other configurations from the "Deployment" subproject:
The "Push image…" configurations create and publish images for Linux and Windows.
Other apps and packages will be accessible in build artifacts of the "Build" configuration (see it on the demo server).
Conclusion
Congratulations! We are done with the demo, and, hopefully, you were able to explore the project on our server or build it yourself.
Microsoft is actively developing .NET 5 in order to provide developers with a single free toolset, enough for building projects of any scale, on any platform. We believe our new .NET runner will allow you to integrate .NET 5 projects with ease.
If you have already tried the new runner and want to share your feedback, please leave the comments.
Imagine you have just switched your TeamCity project over to Kotlin DSL. Your builds run successfully, but what next? What small refactorings can you apply to your Kotlin DSL code to help keep it clean and tidy?
In this article, we’ll discuss the next steps you can take.
If you used the UI before switching to Kotlin DSL, there is a significant chance your build scripts contain a fair number of disabled settings, like obsolete build steps, triggers, and requirements.
Instead of keeping those settings in your build scripts, let’s simply delete them (you can always restore them from your VCS history if needed).
Search for usages of those disabledSettings() calls in IntelliJ IDEA.
Delete the calls, including the corresponding requirement, or the whole requirements block if it’s empty after removal.
Note: If the settings come from a template, be sure to check the consequences of enabling/disabling the template feature.
Requirements – video
2. Remove unnecessary parameters
TeamCity’s configuration parameters are often used (via the UI) to avoid the duplication of settings. However, when using Kotlin DSL, you should try removing these config parameters, add them as constants to a Kotlin Singleton object, and then reference the constants.
If you are configuring complex projects through the TeamCity UI, you are likely using templates to reuse common build steps, triggers or requirements across your project. Instead of using templates, you can refactor them into easily reusable and traceableextension functions.
Template removal – code example
Decide which template feature (build step, trigger, requirement) you want to migrate. Migrate them one after another, rather than all at once.
Here’s an example for build steps:
Write a Kotlin extension function for your build step (or trigger, or requirement) in a separate Kotlin file, to replicate the behavior of your templated build step. The code could look like this:
fun BuildSteps.compileProject(init: GradleBuildStep.() -> Unit = {}) {
   this.gradle {
       name = "Compiles project"
       tasks = "clean build"

       init(this)
   }
}
Use the extension function when creating your BuildTypes:
Once you’ve migrated all your template features, remove the template references in your Kotlin code.
Template removal – video
4. Review agent requirements
Agent requirements can be a pain in large projects. It can make sense to periodically review your requirements and extract them to extension functions for better readability and traceability, just as you do with templates.
Agent requirement – code example
Search for usages of the requirements{} function in your IDE.
Review the requirements and refactor commonly used ones into extension functions.
fun Requirements.windows() {
   contains("teamcity.agent.jvm.os.name", "Windows")
}

object Build : BuildType({
   name = "Build"

   requirements {
     windows()
   }
})
Agent requirement – video
5. Bonus step: disable UI editing
As a bonus step, if you are confident enough in your team’s usage of Kotlin DSL, you can even consider disabling editing in the UI for your TeamCity projects by setting the following internal property (Go to: Administration | Server Administration | Diagnostics | Internal Properties):
teamcity.ui.settings.readOnly=true
What’s next
By applying the refactorings from this article, you will already be taking a tremendous step toward keeping your Kotlin DSL code neat and tidy.
Next you could try to make your project completely self-contained, which means getting rid of all absoluteId() references in your Kotlin Scripts.
As this is potentially a larger, more complex undertaking, we’ll cover how to do this in a future blog post.
If you have any questions or feedback about this tutorial, please feel free to send an email to marco@jetbrains.com.
Over the last few months, the TeamCity team has been busy boosting the performance and stability of our build server. In this post, I’ll explain what steps we took and share the issues we’ve faced.
First, some numbers
On a typical working day, the load on the build server increases after 14:00 CET and starts to drop after 20:00. This is the rush hour, when the number of queued builds is constantly high. For example, take a look at the statistics from February 22 to March 3:
The steps below played a significant role in making the server stable under this load.
Database hardware upgrade
The cheapest and the most straightforward step was probably upgrading the MySQL database used by the build server. When we initially moved the build server to AWS, we used a MySQL server instance with 16 cores and 64 GB of memory. However, it wasn’t enough to sustain the load. The average CPU load was constantly around 75%, so we switched to a larger machine with 32 cores and 128 GB of memory.
The challenge was to perform this upgrade without server downtime and ideally not over the weekend. We found a way to switch all TeamCity nodes from one database to another at runtime without restarting any nodes. As a result, the migration on the morning of December 5th was smooth and non-disruptive. The average CPU usage dropped to 45%, which will do its part to enhance build server performance.
The 4th node
For almost all of 2022, the build server cluster consisted of 3 nodes. By the end of the year, we decided to add a 4th node. The main reason for this decision was to have extra resources to handle the load when we need to bring down nodes, like for maintenance.
This happens from time to time, and is usually because of bugs. For a critical bug, we restart nodes one by one and apply hotfixes. This means until all nodes are restarted (which can take quite a while), our cluster is down to only 2 nodes which may struggle to sustain the workload our build server is dealing with.
Before the end of 2022, we added the 4th node to the cluster. All 4 TeamCity nodes are identical: 64 cores and 500 GB of RAM for each.
Round robin
A round robin of user sessions across all TeamCity nodes was in development for quite some time. It was launched in 2021 and has progressed at different paces over the last couple years.
While all TeamCity nodes appeared and behaved as regular TeamCity servers, some functionality was still missing. For instance, if a user landed on a secondary node, they would not be able to see agent logs or build process thread dumps.
It took some time to find all of the limitations and eliminate most of them. By mid-2022, we felt confident that secondary nodes would act almost identically to the primary node. At this point, we launched an experiment where a group of volunteers from the TeamCity team started using the secondary node to carry out their daily work.
Several months later, in December 2022, we expanded this round robin for all build server users. This caused some confusion, as some UI features were still unavailable on the secondary nodes, but overall it went well. If you paid close attention, you’d notice this small selector in the footer:
This selector allows you to check your current node and switch to another one. If certain functionality does not work as expected on a secondary node, switch to the primary node-1.
Fixing the event lag
When something important happens with major TeamCity objects (such as builds or projects), the node where the object’s state was changed publishes something called a “multi-node event”. This event is transmitted to all of the other nodes in a cluster. Depending on the event type, these other nodes may update their own in-memory caches and objects.
As time went by, our build server ran more and more concurrent builds, processed bigger build queues, and handled more agents. This resulted in a significant increase in events and revealed bottlenecks and inefficiencies in the code that processes these events, which usually looked like the following:
We called it the “event lag”. As you can see in the image above, linux-2 and linux-3 nodes cannot process all of the incoming events in time, and the backlog of unprocessed events grows rapidly. At a certain point, nodes are unable to recover and have to be restarted. The event lag was a critical issue that kept us from routing users to secondary nodes – the secondary nodes would simply miss the most recent data there.
This major issue had no quick and easy fix. Instead, we had to rewrite our code to process most of the events in batches and modify the processing logic for other cases. In the end, we managed to resolve this problem. Now, even a hot day on a TeamCity build server looks like this:
Improving build queue processing performance
The TeamCity build queue bottleneck was previously described in this blog post.
We’ve managed to solve most of the issues mentioned there. Since then, the queue processing algorithm has become more parallel, and we’ve improved its performance even further. TeamCity can now process 20k builds in the queue without significant delays. The time required to process a queue this large is still 2-3 minutes, but the previous time was much higher than that.
Despite the progress that has been made, we’re not calling it a day yet. We will keep looking for a way to further speed up the queue processing.
Change collecting on multiple nodes
Previously, we had a dedicated node (node-3) to perform all “change collecting” operations whether they were caused by a commit hook, regular VCS polling, or the start of a build.
As a result, this node was sometimes overloaded with all of the requests to collect changes in different VCS roots, especially when many large build chains were triggered simultaneously.
In mid-February 2023, we enabled an experimental mode in which “change collecting” operations can be performed by any node in the cluster in parallel, as long as the single VCS root is being processed by one node only. This mode should improve throughput for such operations, reduce delays, and allow us to restart the nodes more easily if necessary.
What’s in the lab?
We’ve been cooking up a few more enhancements for quite some time now. Here they are at a glance:
Build log service
Occasionally, build logs get corrupted. We’re fairly certain that this happens when multiple nodes update the same build log. Despite our best efforts to set these updates aside across the running build lifetime, it still happens. To tackle this issue, we’re preparing a dedicated service. Instead of updating build logs directly, all nodes will send change requests to this service, eliminating the issue and ensuring there’s only one log writer.
Central repository for all configuration files
TeamCity keeps configuration files of all the projects on disk. This location is shared with all the nodes via a network file system. However, only one node can perform direct modifications of the files on disk. Other nodes need to send a request in order to perform any modifications.
When a project is modified and its configuration files are updated, a multi-node event fires to let other nodes know they should reload this project’s settings from the disk. While this approach works most of the time, it has obvious flaws. For instance, the project may be modified further while nodes are reloading it from the disk.
As a result, the nodes may get an inconsistent view of the project settings. We perform re-tries to work around this issue, but it’s still a workaround rather than a solid solution. This issue is probably one of the reasons why you sometimes see messages in the header saying “Critical errors in configuration files”.
To fix this problem, we want to move all of the configuration files to a Git repository. Then multi-node events will be able to send hashes of the VCS commits, which should improve the atomicity and precision of the reload operations.
In the longer term, we’ll be able to remove configuration files from the shared disk, thus making us less dependent on network storage.
This article was originally written by Nicholas Thomson and Kassen Qian of Datadog and published on the Datadog blog.
As the complexity of modern software development lifecycles increases, it’s important to have a comprehensive monitoring solution for your continuous integration (CI) pipelines so that you can quickly pinpoint and triage issues, especially when you have a large number of pipelines running.
Datadog now offers deep, end-to-end visibility into your TeamCity builds with the new TeamCity integration for CI Pipeline Visibility, helping you identify bottlenecks in your CI system, track and address performance regressions, and proactively improve the efficiency of your CI system.
Making data-driven decisions to increase the performance and reliability of your pipelines will help you improve end-user experience by allowing your team to push code releases faster and with fewer errors.
In this post, we’ll show you how to:
Integrate TeamCity with CI Visibility
Investigate pipeline failures to fix erroneous builds
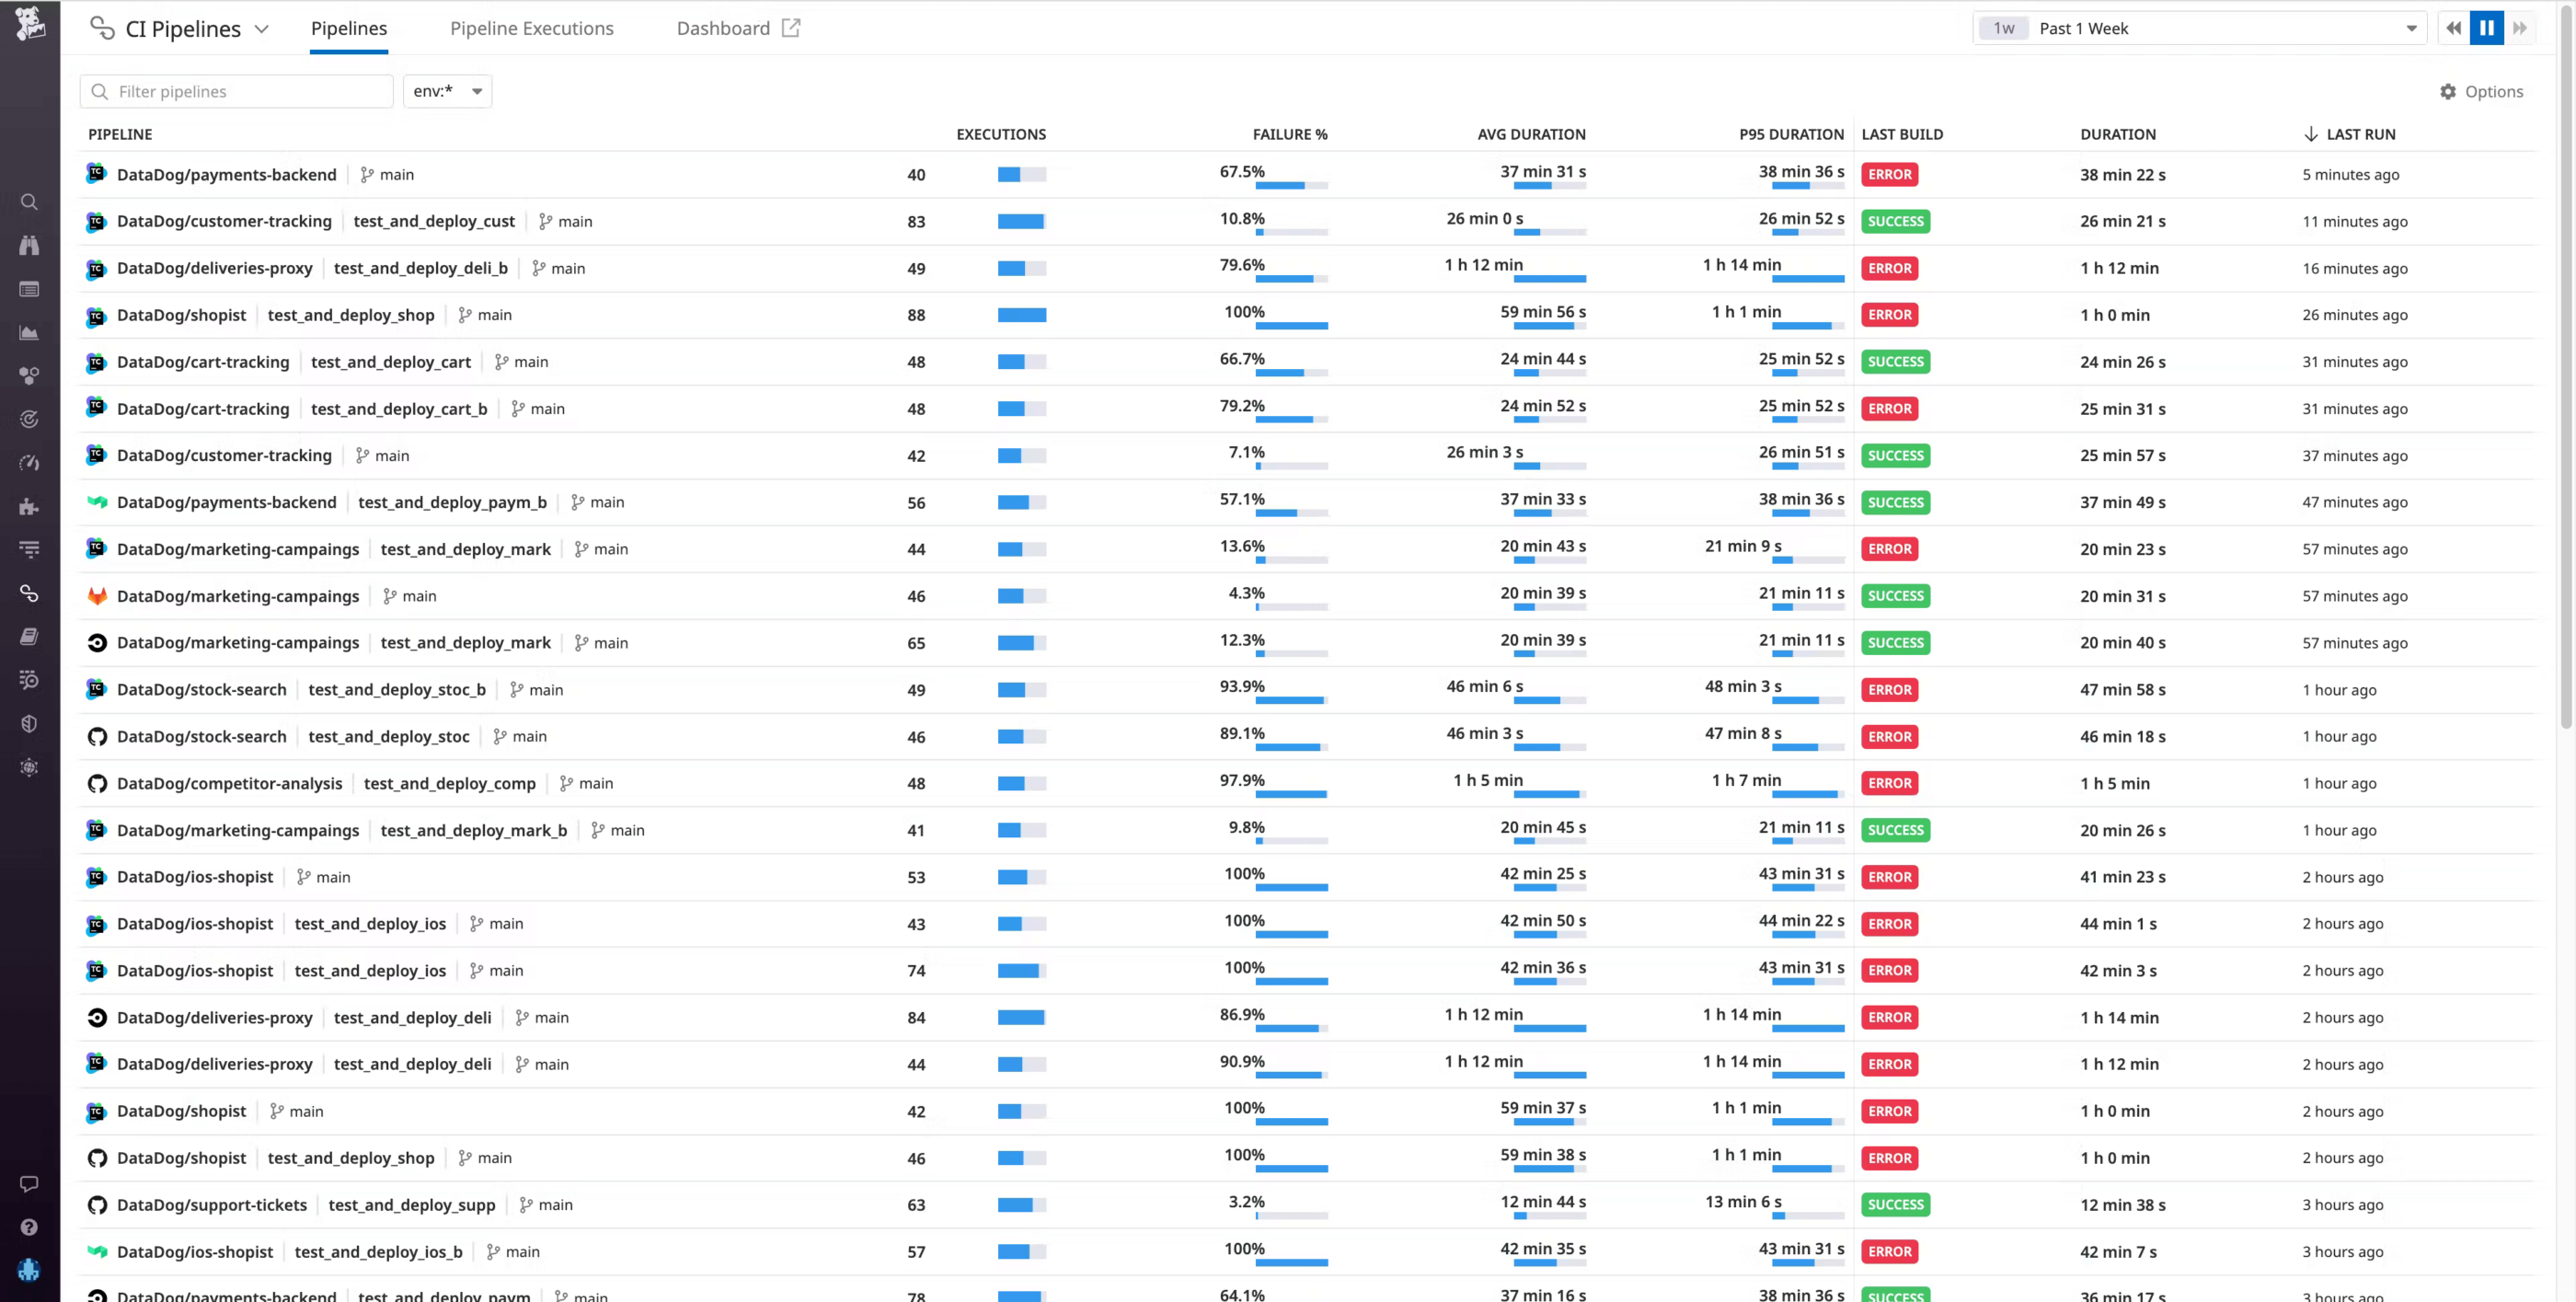
Once you’ve enabled the integration, data from your TeamCity pipelines will automatically flow into Datadog. If you navigate to the Pipelines page, you can see TeamCity pipelines alongside any other providers you may have instrumented with CI Visibility.
Investigate pipeline failures to fix erroneous builds
After you enable the TeamCity integration in CI Visibility, you can use the Pipeline overview page to get a high-level view of the health and performance of your TeamCity build chains, with key metrics such as executions, failure rate, build duration, and more.
Say you’re an engineer at an e-commerce company where one of the checkout services for your primary application is undergoing a major revamp under a tight deadline. After pushing new code, you notice that your builds are extremely slow—much slower than normal. You can go to the Pipelines page in CI Visibility to confirm if your particular pipeline is experiencing high build durations. Then, you can click on the build chain from the Pipeline overview page to investigate the pipeline in more detail.
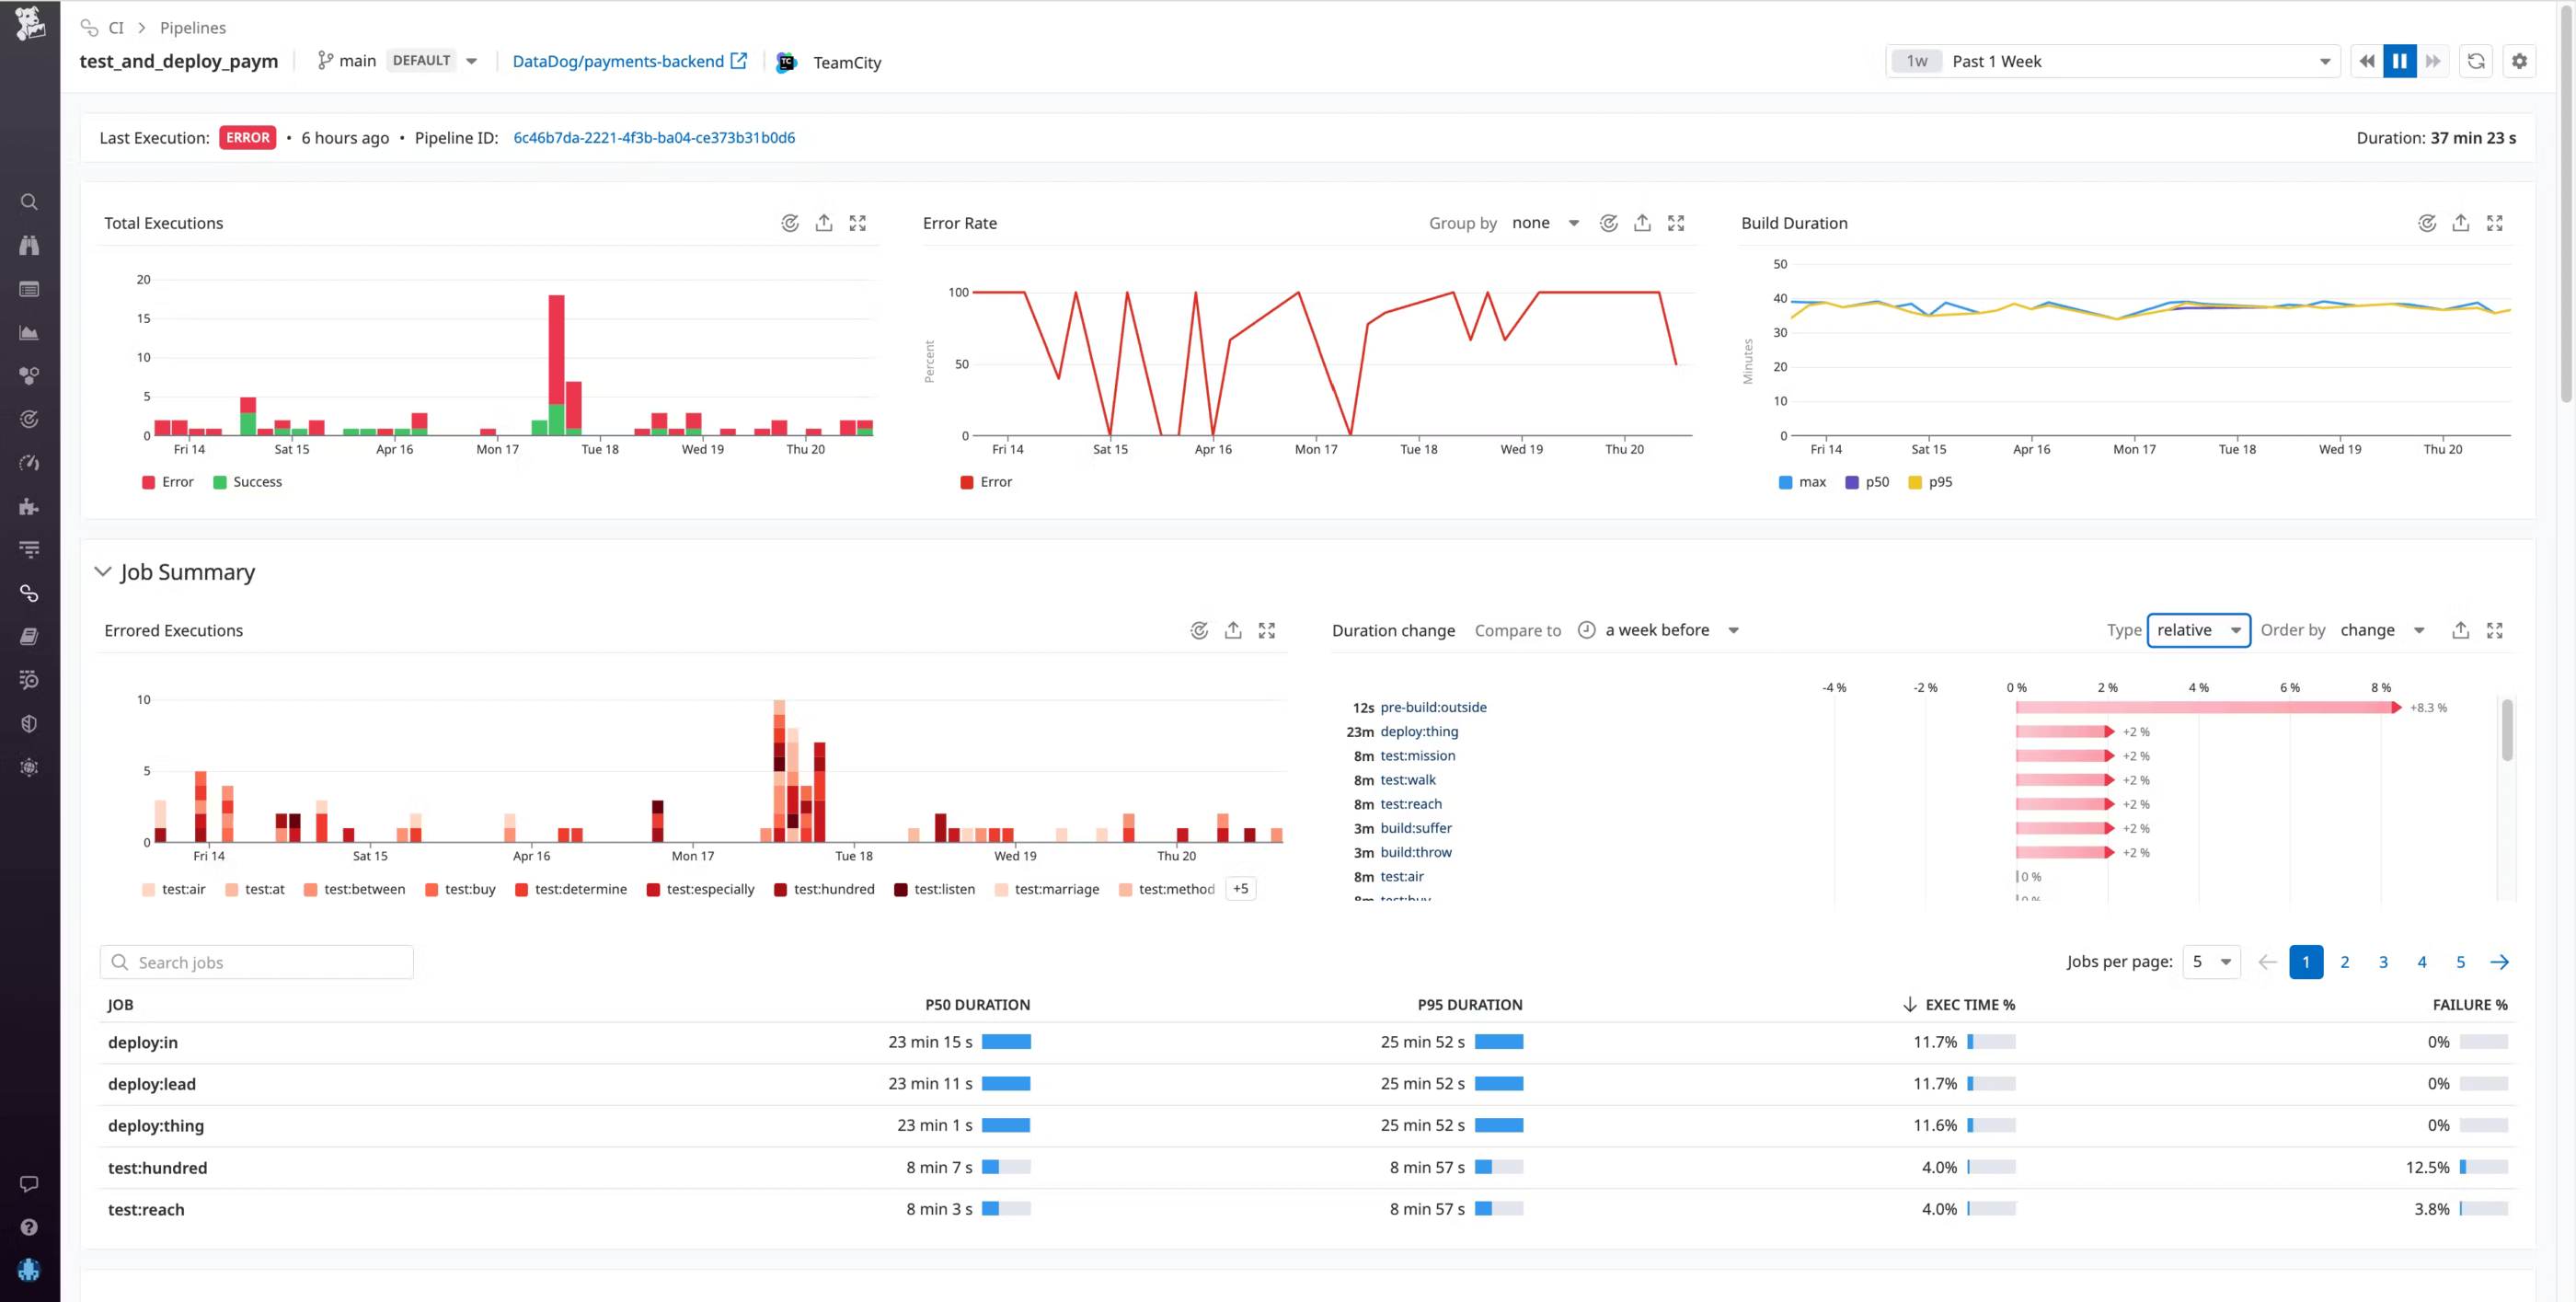
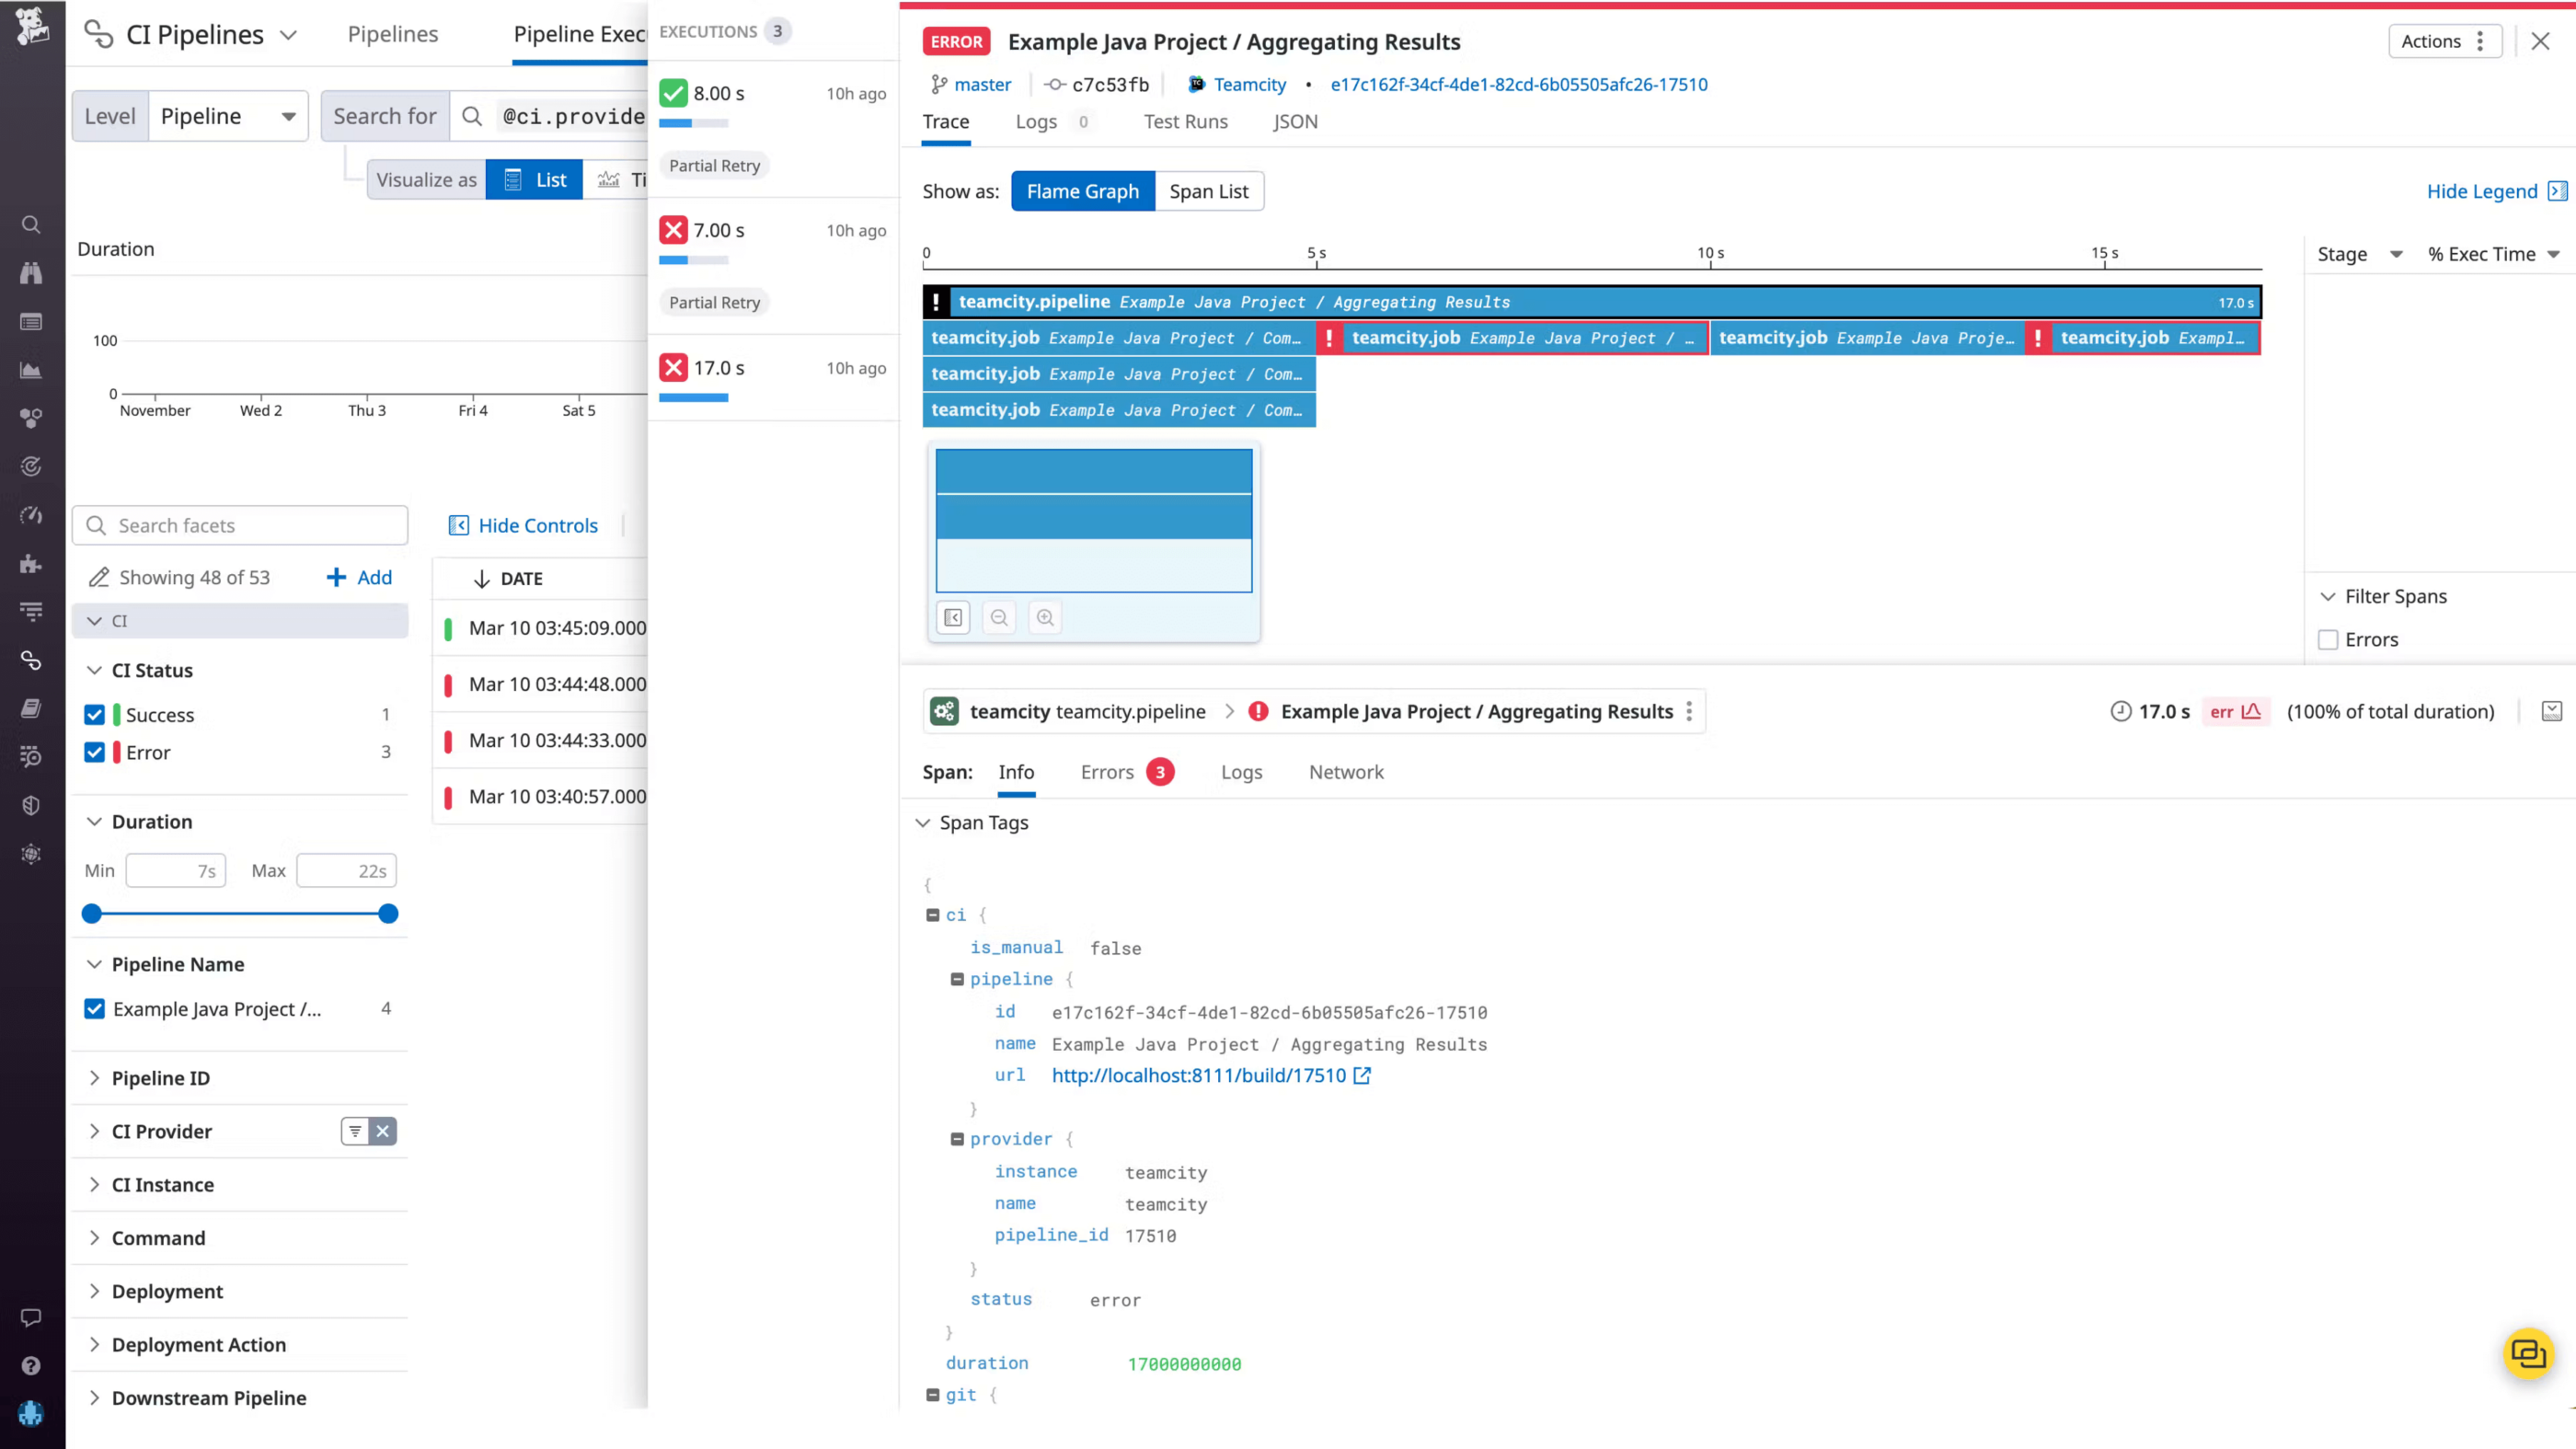
At the top of this Pipeline Detail view, you can see the status of the last build, with a link to the build chain in TeamCity. Below that are timeseries widgets illustrating the total number of builds, the error rate, build duration, and other key metrics that can help you determine when the build chain began to experience errors. In this case, you see the error rate spiking repeatedly over the past several days.
The Job Summary gives you more granular information about your build chain, such as which specific jobs in this pipeline failed the most, which ones took the longest, and which jobs have experienced performance regressions compared to the previous week. Information like this can help you identify the areas in your CI system where optimization will result in the greatest performance gains.
To investigate further, you can scroll down to see the individual builds for this pipeline. If you click on an execution, you can see a flame graph view that visually breaks down the pipeline execution into the individual jobs that ran sequentially and in parallel.
The flame graph shows you each build’s respective duration broken down by job and, if the build was erroneous, the exact parts of the build that failed. This can help you pinpoint problematic jobs that may be at the root of a failed build.
The Info tab shows you repository and commit information along with other git metadata, so you can easily see the source of each build. To investigate further, you reach out to the team member who pushed the commit for this build and discover that the issue is caused by a typo. (We strongly recommend that customers use a TeamCity username style that contains author email, so that Datadog can automatically detect git author email addresses and correlate commit information to pipeline data.)
Once resolved, the build chain functions without error so you can build and test successfully, and release your updated checkout service to customers on time.
Understand and optimize TeamCity build chain performance
CI Visibility support for TeamCity is now generally available, giving you deep visibility into your build chains so you can troubleshoot failed builds, identify performance regressions faster, and increase your release velocity.
To help you take advantage of the Kotlin DSL’s capabilities and simplify the build configuration process, we’ve created extensive Kotlin DSL documentation. It comes with examples that you can simply copy-paste directly into your code base.
How the Kotlin DSL documentation works
Every TeamCity server has its own Kotlin DSL documentation, which is automatically curated to match the TeamCity version and any plugins installed on the server. If you install a new plugin, the documentation compiles again, providing you with relevant examples. You can also refer to the general Kotlin DSL documentation, which is available in the TeamCity docs.
Accessing the Kotlin DSL documentation from IntelliJ IDEA
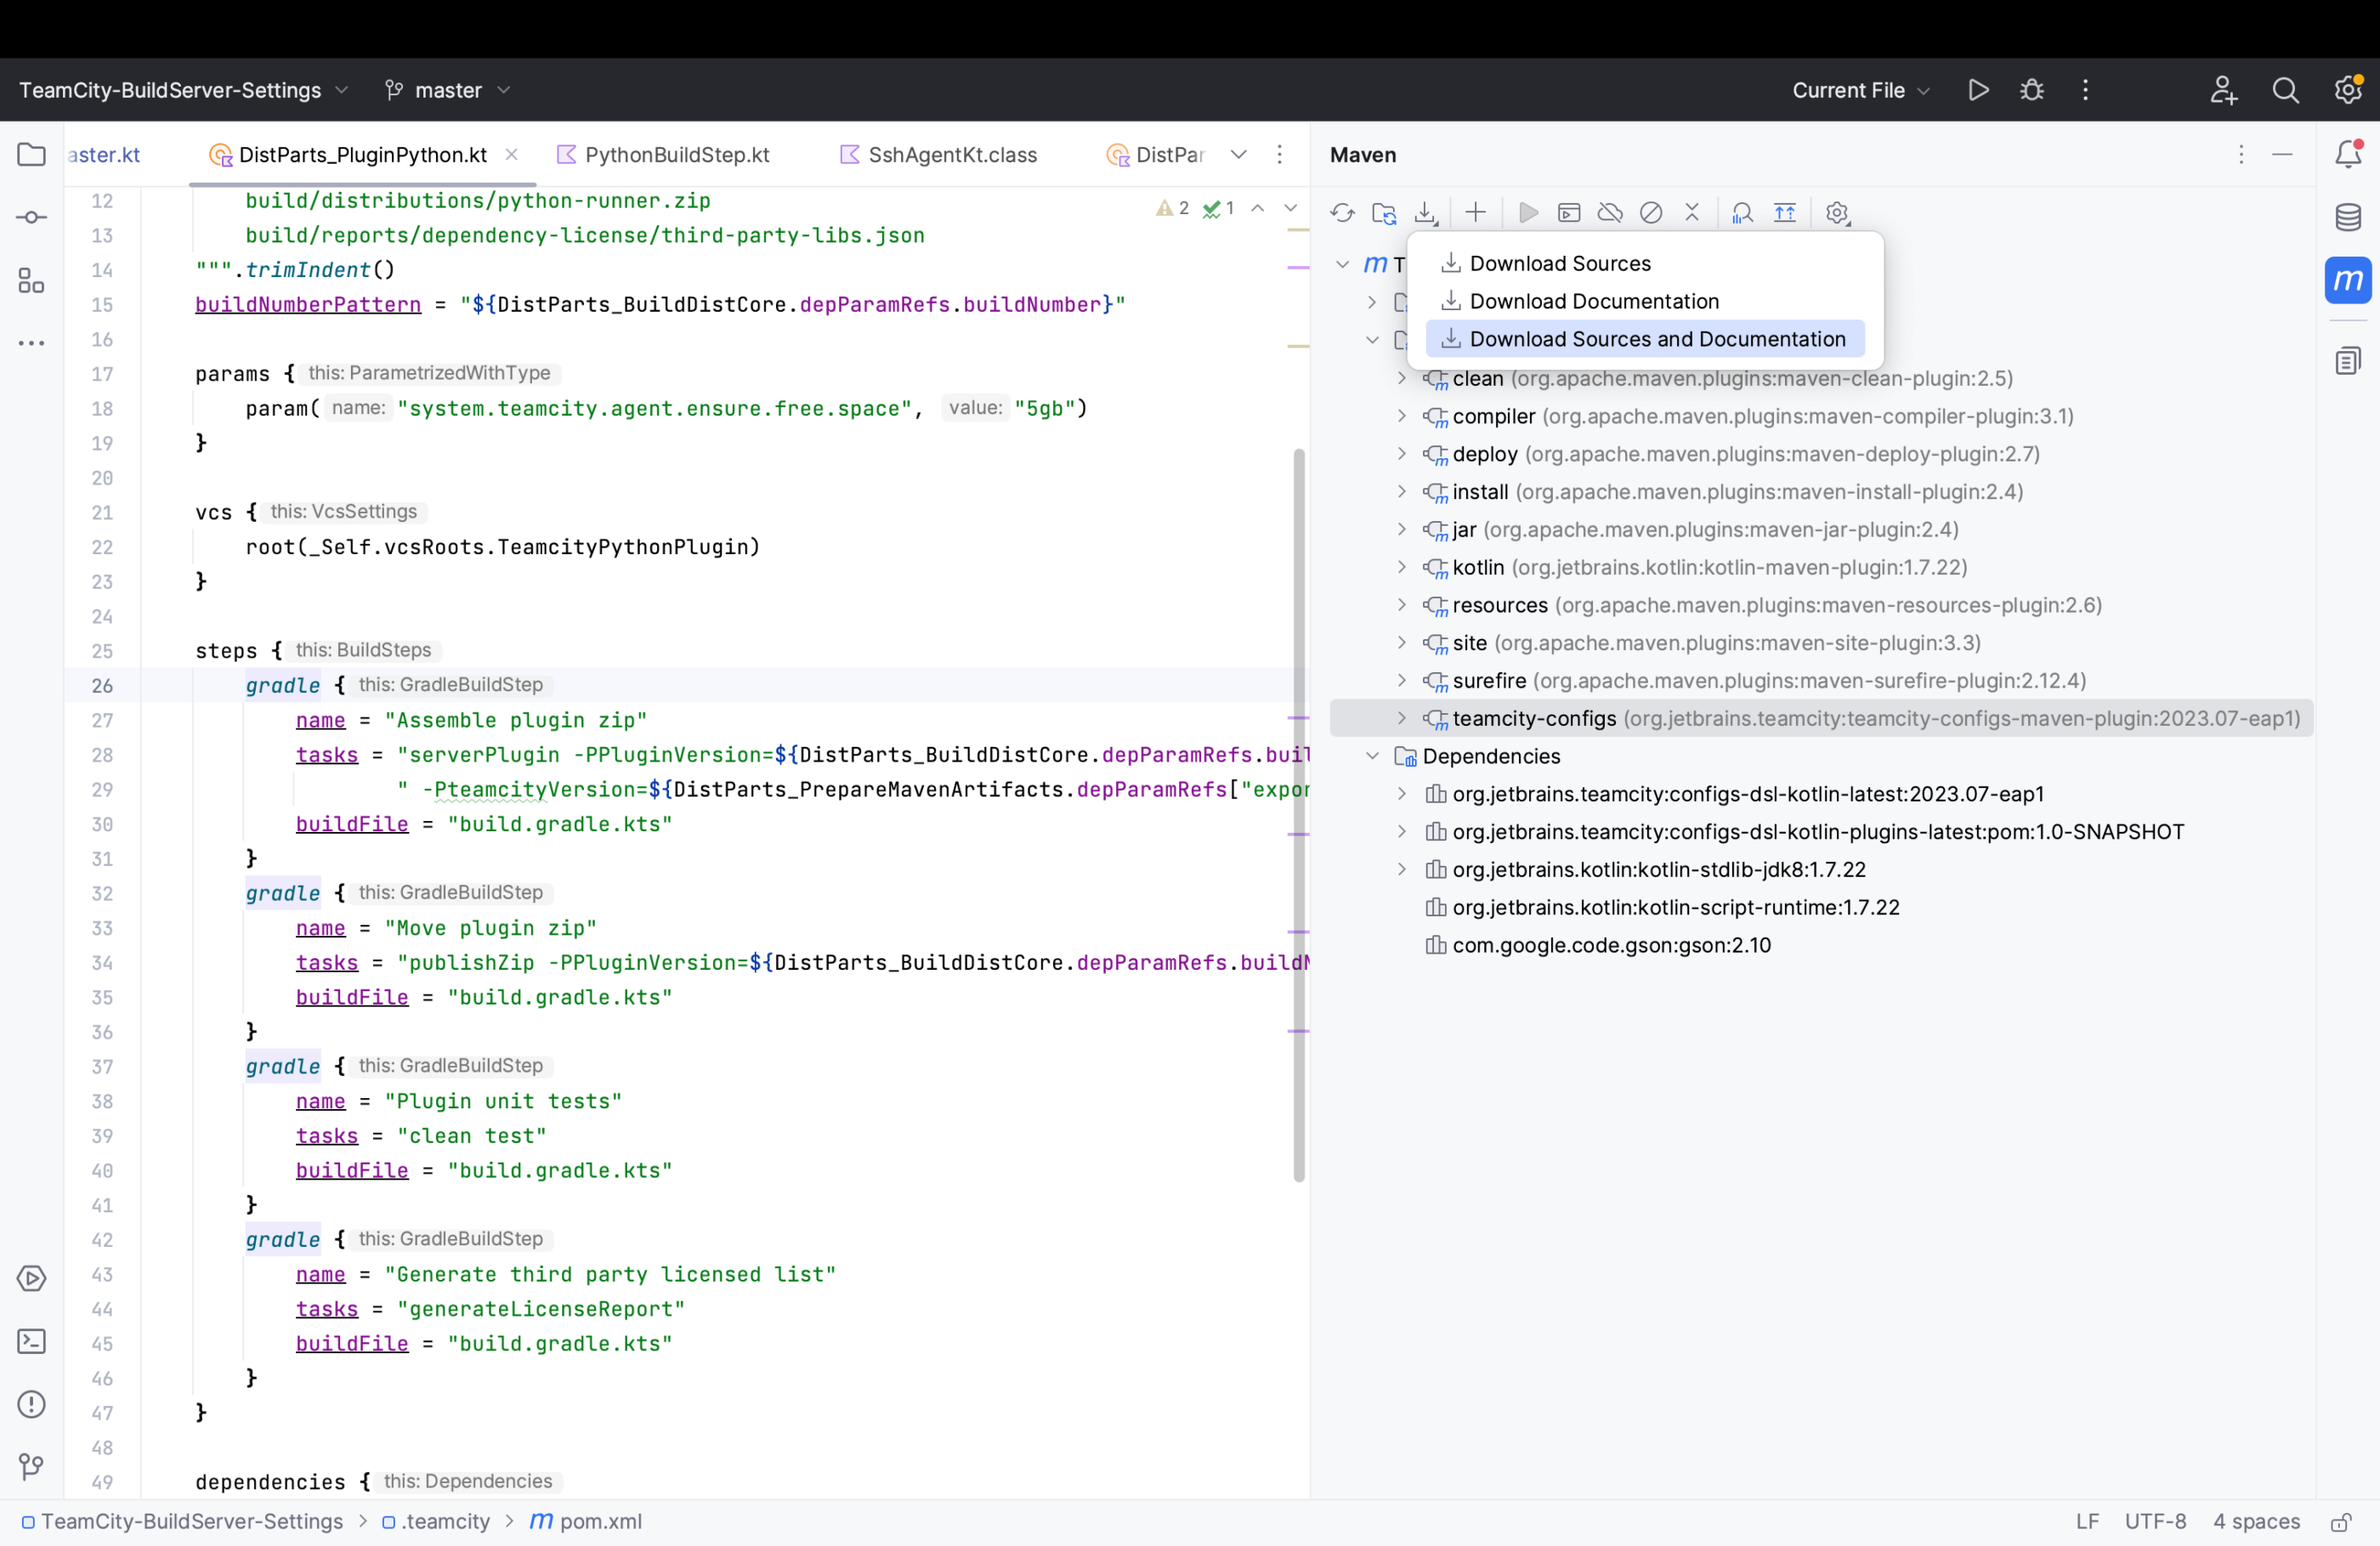
The Kotlin DSL documentation is available right from IntelliJ IDEA (both Ultimate and Community editions). You can access it by going to Maven Tool Window | Download Sources and Documentation.
Another way to access the Kotlin DSL documentation directly from your IDE is to run the mvn -U dependency:sources command.
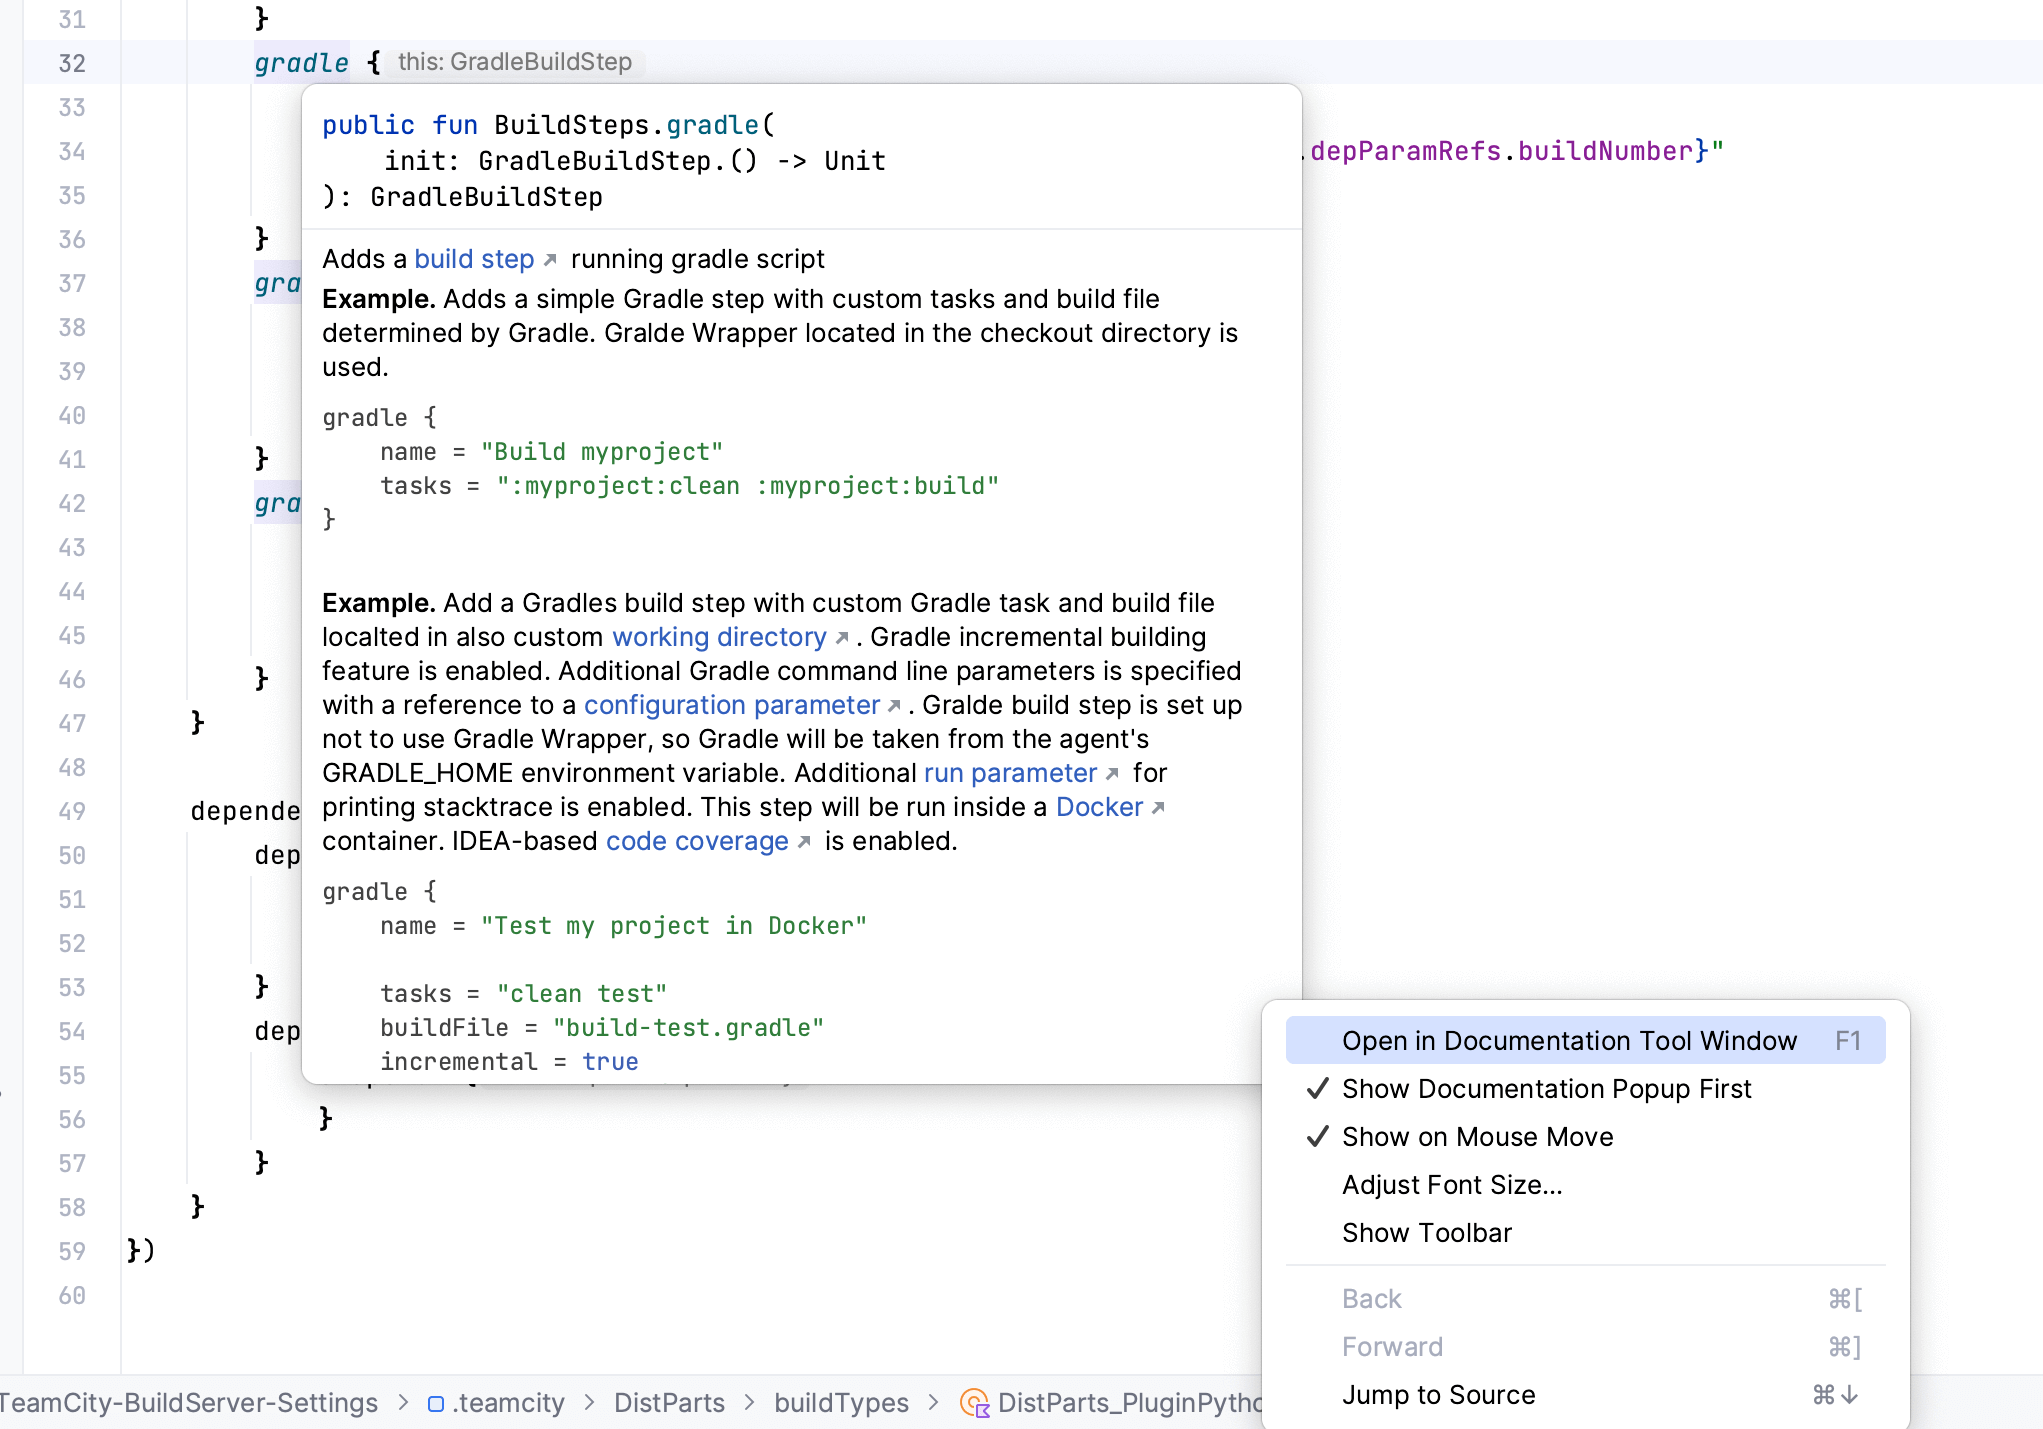
The documentation’s context and examples change when you click on an entity (for example, a build step or a trigger). The information is displayed either in a popup window or in the panel on the left, depending on the settings you’ve selected.
There are a few different ways to open the Kotlin DSL examples from your IDE:
Pressing F1 on Mac or Ctrl + Q on Windows. Refer to this section of the IntelliJ IDEA documentation for more details.
Clicking on the name of an entity (such as a build step or a command). The examples will open in the menu on the right-hand side of the window.
Simply hovering over an entity to access the in-line information window.
How this feature is helpful
Using Kotlin DSL examples can save you time when configuring your pipelines as code. The examples also make it easier to discover all of the things you can do when configuring builds, in addition to helping you identify the scenarios that TeamCity can support.
Working with the Kotlin DSL examples can be a particularly great option when you are just getting started, as they provide a solid foundation on which to build your understanding of the Kotlin DSL.
TeamCity also provides you with an option to view your settings as code with the help of the View as code button, which is available on the build level. This displays your settings as code that you can copy and paste to your codebase.
If your project can’t be configured via the UI and you’d still like to experiment with the View as code feature, consider setting up a sandbox project on your TeamCity server. It will give you a chance to play around with different TeamCity features and see how they look in the Kotlin DSL.
Further resources
If you’d like to learn more about using the Kotlin DSL for TeamCity, here are some additional resources that you might find useful:
Do you have any questions or comments about how we can improve the Kotlin DSL examples and documentation? We’d love to get your feedback! Feel free to share it in the comment section below.
There are plenty of options available when it comes to selecting a CI/CD tool for your organization. A direct feature comparison on third-party websites like G2 can help you get a solid understanding of a tool’s core functionality.
However, you might still find it challenging to understand whether a tool is capable of meeting your specific requirements, how easy it is to use, or how compliant it is with your industry regulations.
In this blog post, we offer general guidelines for selecting an appropriate CI/CD solution and delve into how TeamCity fits into this framework. We hope it will help you make an informed decision when choosing the best CI/CD tool for your organization.
Choosing the right CI/CD tool for your needs and goals
The needs for a CI/CD solution can vary greatly between teams, and a tool that serves one team perfectly might not be as suitable for another.
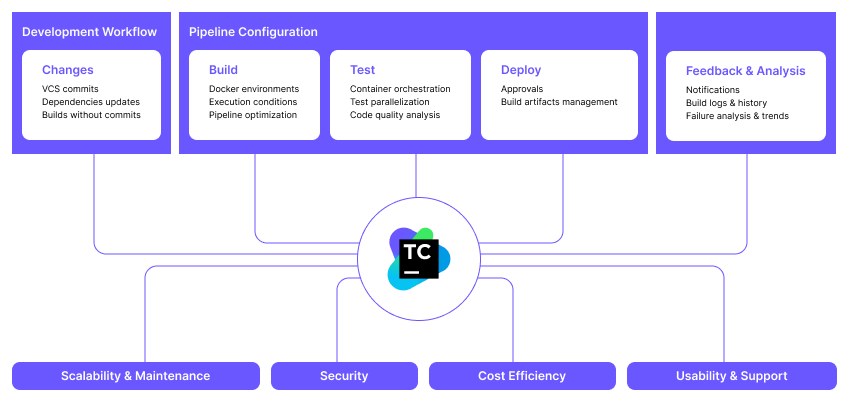
Here, we suggest seven main factors to consider when choosing a CI/CD solution for your team.
Development workflow. The CI/CD tool should integrate smoothly into your development workflows without requiring you to write too many custom scripts or plugins.
Pipeline configuration. The CI/CD tool should offer a flexible setup for environments, security checks, approvals, and more to allow the proper flow of artifacts and dependencies between build steps.
Feedback and analysis. The CI/CD tool should provide comprehensive feedback on multiple levels, from error messages to infrastructure performance, to ensure fast problem resolution and an uninterrupted delivery process.
Scalability and maintenance. Moving from one CI/CD tool to another can take months of work, which makes it very important to use a solution that will cover all of your future needs from the outset.
Security. It’s critical to prevent malicious actors from stealing your source code, hacking into your infrastructure, or compromising the end product.
Cost efficiency. When evaluating a CI/CD solution, it’s not only crucial to look at the price of a license or a subscription but also the operational and maintenance expenses.
Usability and support. Every developer, even without prior experience in continuous delivery, should be able to understand how their project is built and deployed, and how to effectively use the CI/CD tool to deliver changes faster.
Hosting model. Depending on your company’s needs, you might consider using a cloud or self-hosted solution. Both options have their advantages, so the final choice entirely depends on your specific needs.
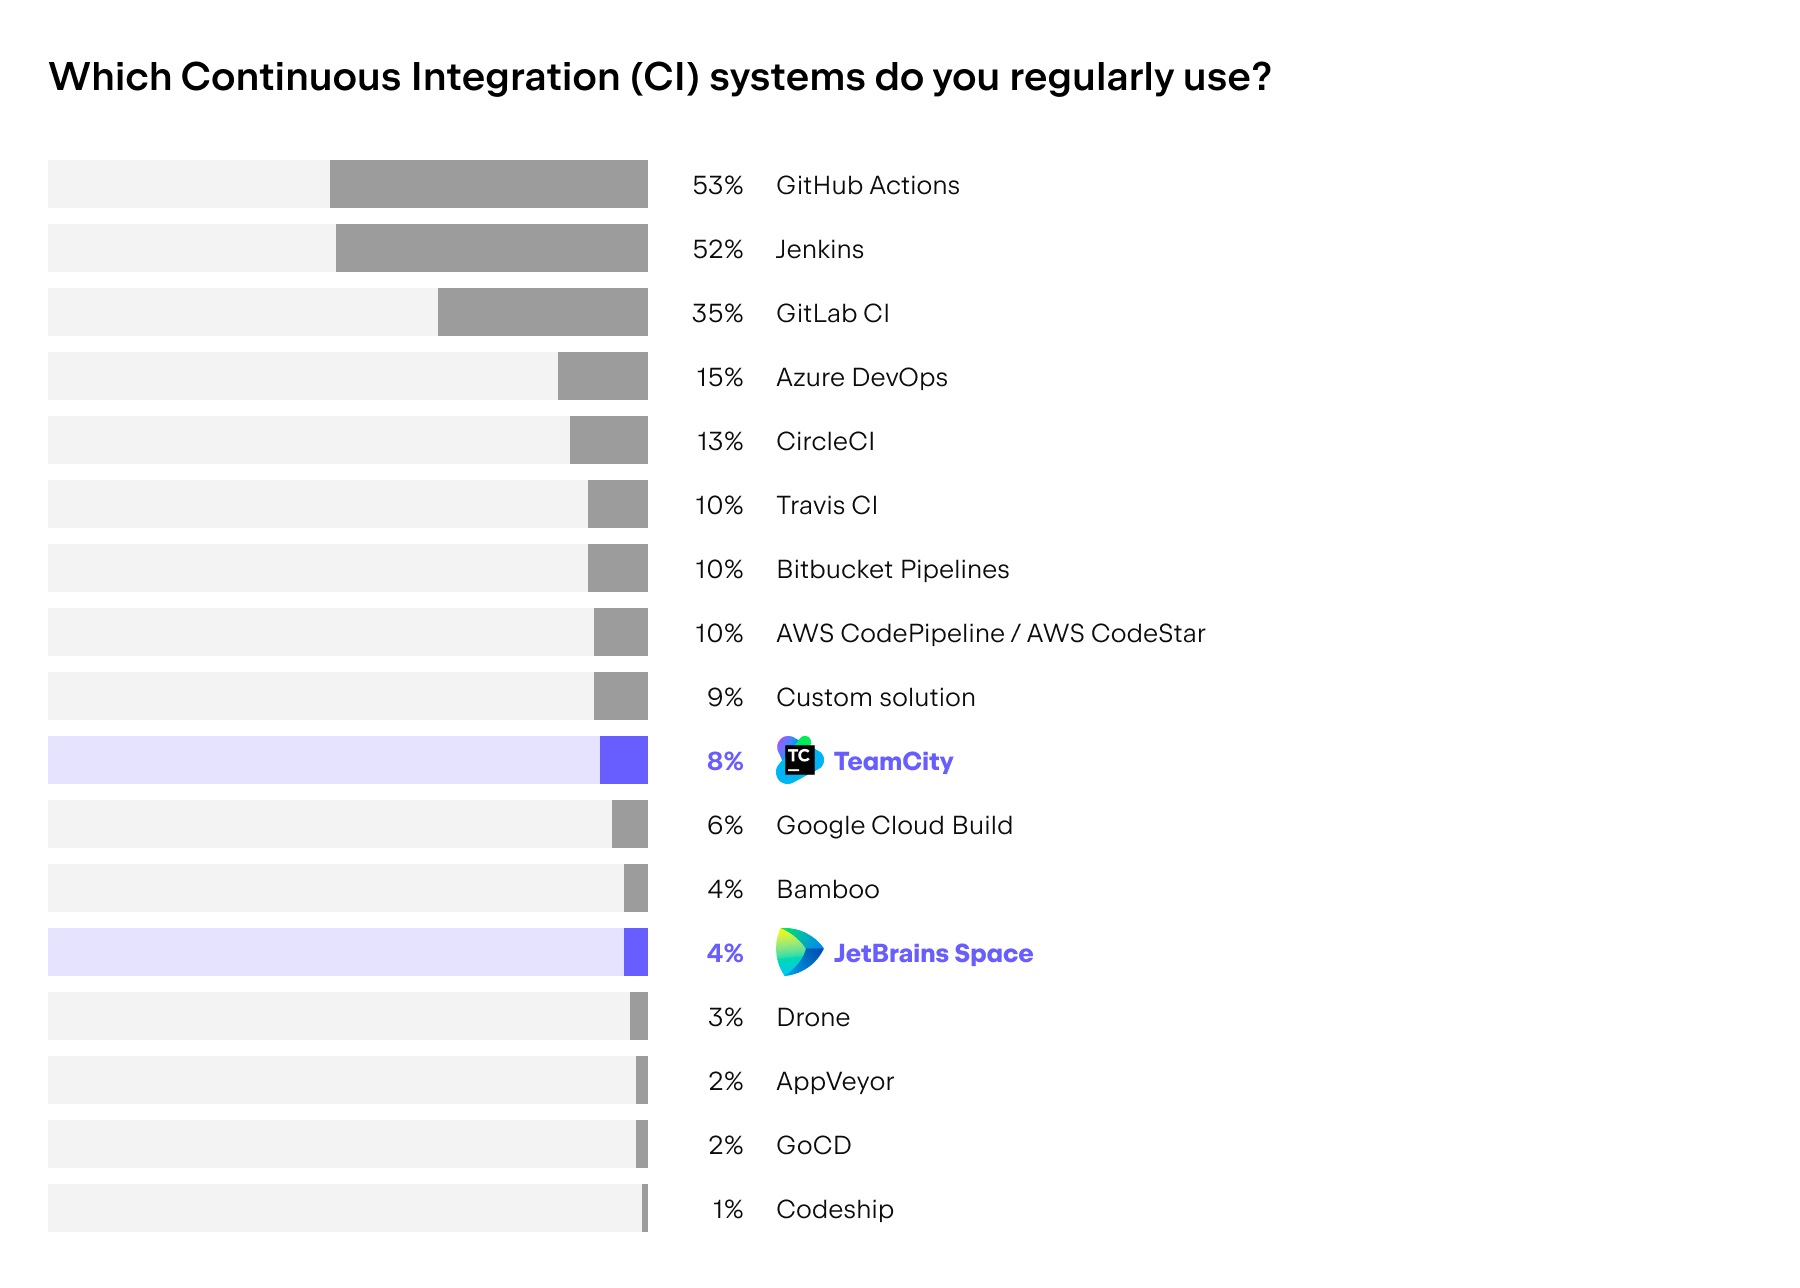
All modern solutions offer essential features, such as Docker support, configuration as code, or automatic building of pull requests. For smaller projects, the differences between these solutions may not be as significant.
However, as your team grows and your workflows become more complex, it becomes increasingly difficult to set up the pipelines correctly and ensure they function as intended. In such cases, your experience with different CI/CD tools may vary greatly.
When evaluating a continuous integration tool, it is important to understand to what extent the tool can be customized to your workflow, and to what extent your team will need to adjust its processes to the tool. Consider the following aspects:
Diversity of your change workflows
Your team may require the ability to build every pull request, run the pipeline when someone commits to a specific branch, or trigger a build when a particular user changes files within a particular directory.
Sometimes, you may need to run the build pipeline without committing changes to the repository to ensure that you never commit broken code and avoid negatively affecting your team members’ efforts.
Your code may be distributed across multiple version control systems (VCSs) of different types or live in a monorepo. You may need to rebuild and redeploy the application whenever an external dependency, such as a Maven package or a Docker container, is updated.
By carefully evaluating a CI/CD tool’s support for your specific change workflows, you can ensure that the tool is a good fit for your team and minimize the need for changes in your own processes.
Docker and non-Docker workflows
While Docker can provide a convenient and efficient approach to building many types of applications, there are situations where running on an actual OS is necessary. For instance, if your application relies on integration with a hardware component that cannot be accessed from a Docker container, you may require an OS-based workflow.
Similarly, a Docker-based workflow may be insufficient for your team’s needs if your software requires interaction with an OS, such as when developing a system driver or a Windows service.
When choosing the best CI tool for your team, evaluate your specific project requirements and consider the advantages and limitations of both approaches.
Team maturity
Teams just beginning their journey with continuous integration may be more flexible in adapting their workflow to fit a particular solution. Thus, tools with fewer configurable options may provide a simpler and more streamlined user experience.
In contrast, highly skilled teams that precisely understand their needs may find all-inclusive DevOps platforms limiting, as these solutions might not offer the required level of flexibility and customization.
Ease of migration
When selecting a new CI/CD tool, ease of migration should be one of the key considerations. In many cases, it may be simpler to migrate to a standalone CI/CD tool rather than to a complete DevOps platform. This way, users can migrate in batches, you’ll have to write fewer manual integrations, and it will minimize disruption to your development workflows.
Organizational aspects
It’s vital to consider the culture and policies of your organization, particularly if teams are encouraged to select their own development tools.
Keep in mind that some team members may resist changes to their workflow, especially if they are comfortable and familiar with their current tools.
Development workflow support in TeamCity
TeamCity is an excellent fit for the following workflows:
Support for multiple VCSs.
Ability to run CI/CD processes without committing.
Granular control of changes (filtering by branches, usernames, file masks, etc.).
Trigger-defined parameters.
Comprehensive API to integrate with other tools.
While it may be tricky to choose between the streamlined experience of a platform and the flexibility of a standalone tool, the good news is that one doesn’t necessarily prevent you from using the other.
Since it’s common for teams to use multiple CI/CD tools concurrently, you might as well use a combination of a standalone solution and an all-inclusive DevOps platform as long as there’s proper integration between the two.
Pipeline configuration
Every team has its own unique workflow and requirements, which makes using a customizable CI/CD tool that fully meets your needs vital. Here are the different types of pipeline configuration that you might consider when choosing a CI/CD tool.
UI and code-based configuration
Some tools offer a UI-based configuration approach that provides an easy way to get started and maintain the setup, as the pipelines can be configured without any special knowledge.
All modern tools support configuration as code, which gives you a versioned configuration history.
Many tools use YAML configurations, which provide a very straightforward way to automate the building and testing of simple apps. However, managing YAML files can become increasingly difficult as the team and infrastructure become more complex.
For large-scale projects, it might be more effective to configure CI/CD using a fully-fledged programming language, which allows using loops, conditional statements, and other language constructs. In addition, it makes it easy to write the configuration code in an IDE and take advantage of its refactoring and debugging features.
Workflow customization
Customization is a critical aspect of selecting a CI/CD tool, as it allows teams to create pipelines that match their specific build and deployment workflows.
Depending on the trigger event, such as a code commit, a dependency update, or a scheduled trigger, teams may want to customize the build environment, scope of testing, Docker image tag, and other pipeline components.
If you need to execute specific steps sequentially on the same build agent (for example, you might want to start a Windows service and then run a build on the same system), the chosen CI/CD tool should provide the ability to set this up exactly as needed.
Environment configuration
When selecting a CI/CD tool, it is essential to consider the level of customization it provides in terms of environment configuration. Specifically, teams should be able to choose the build environment that best fits their requirements, whether using Docker containers, cloud build agents, bare metal servers, or hybrid options.
As discussed in the Scalability section above, there are various optimization techniques that can help teams to complete builds faster and shorten the feedback loop.
One key optimization technique is the ability to cache dependencies, which can help minimize build times by avoiding having to download and install dependencies every time a build is run. Additionally, the ability to reuse build artifacts can further reduce build times, as previously-built components can be reused in subsequent builds.
Parallelizing tests across multiple build agents is another effective way to optimize pipelines in large projects. By spreading tests across multiple build agents, teams can reduce the time required to run all tests, helping to shorten the feedback loop and ensure that issues are identified and addressed more quickly.
💡Parallel tests revolutionized how we develop and test TeamCity. Our own integration tests have become over 10x faster, dropping from four hours to about 20 minutes.
Artifact management
Producing and propagating artifacts is essential to any CI/CD pipeline. Artifacts allow your builds to “communicate” and pass the data from one build to another.
By choosing a CI/CD tool that can store artifacts, you can store the data produced by your builds for further analysis and debugging.
Feedback and analysis
The primary purpose of CI/CD is to shorten the time it takes to receive feedback on the changes you make to your software. The most actionable feedback is the one that is directly tied to specific code changes and provides information about the status of builds and deployments, as well as changes in performance and quality metrics.
When evaluating a CI/CD solution, the following aspects must be considered:
Analysis of build results
CI/CD tools should provide a detailed analysis of build results, including information on failed tests, build times, error logs, and other key metrics. This information should be easily accessible and presented in a way that allows developers to identify and address issues quickly.
Trends
It is important for CI/CD tools to provide trend analysis capabilities, allowing teams to track changes in build and deployment performance over time. This can help teams to identify patterns and trends and proactively address potential issues before they become more serious.
Performance monitoring
To identify bottlenecks and resolve issues that affect the efficiency of the CI/CD process, it is critical to be able to profile the performance of build agents and identify the need to provision more resources to the build infrastructure.
It’s important for a CI/CD tool to be able to analyze and detect flaky tests. To shorten the feedback loop and speed up your development process, look for a tool that can identify flaky tests for you and highlight them in the test results.
Scalability and maintenance
Software projects tend to grow in size and complexity. A reliable CI/CD system must be able to handle this growth and keep pace with the growing number of pipelines, builds, users, roles, and workflows.
To ensure that your team is never held back, the system should be able to efficiently manage resources and be equipped with monitoring and maintenance tools to resolve any issues that arise quickly.
The following factors will help you understand the level of scalability required for your team.
User management
In small-scale projects, it’s usually sufficient to have basic role-based access rules that define who can trigger builds, view build results, or modify the pipeline configuration. Large teams require more advanced features, such as LDAP integration or single sign-on (SSO) support, two-factor authentication, project hierarchy, granular permission management, approval workflows, and audits.
As the frequency of commits and the complexity of workflows increases, it becomes important to utilize the resources of the CI/CD efficiently. This can be done by reusing build artifacts and minimizing the number of unnecessary rebuilds, reordering build queues, parallelizing tests, and via other similar features.
Project templates
The larger your organization is, the more you will benefit from using project templates. By standardizing typical workflows, you can significantly reduce the effort required to create and maintain pipelines, improve collaboration between teams, prevent misconfigurations, and increase the security of your CI/CD pipelines.
In this case study, Gearbox, an award-winning game development company, shares how they were able to streamline their CI/CD processes and standardize their CI/CD practices with the help of TeamCity’s reusable project templates.
As the number of projects grows and the demand for computing resources increases, it becomes more challenging to scale the build infrastructure and mitigate the risks of potential downtimes.
Typical requirements of large companies include automated provisioning of build agents (such as by integrating with cloud platforms) and the ability to organize build agents in pools for easier management.
Enterprise-level solutions pay a lot of attention to high-availability features, such as the ability to run multiple application servers in a clustered environment and smart load balancing.
Maintenance and upgrade
To identify and resolve issues in the CI/CD setup, administrators should have the monitoring and logging tools and be able to increase resources, implement caching mechanisms, or update artifact retention policies when needed.
Special attention should be given to upgrading the solution. Some CI/CD tools rely on external plugins so heavily that upgrading them without breaking existing functionality may be difficult or even impossible.
A scalable CI/CD solution may not be crucial for small teams and projects with limited complexity. However, as the size of the team and the complexity of the project increase, it becomes one of the most critical aspects of the software development process.
How TeamCity supports scalability
TeamCity can support projects of any size, including projects with a vast amount of dependencies. It can scale automatically during periods of high load. One instance of TeamCity Server can stably work with 1,000+ build agents.
Security is a major consideration for any software development process, and it is especially critical for CI/CD, as CI/CD tools are given trusted access to sensitive data and systems.
When evaluating a solution, look at the security features from two main perspectives:
Security of the service. With new threats and vulnerabilities emerging every day, the solution must ensure that potential attackers can’t get access to your source code, secret keys, build infrastructure, or build results.
Security of the end product. Many CI/CD tools allow integrating security checks into the build pipelines to ensure that the resulting software doesn’t have vulnerabilities that can be exploited.
Some teams tend to prioritize speed and efficiency over security, which can lead to shortcuts and neglect of security best practices. Integrated platforms generally provide an easier way to secure CI/CD at the cost of “vendor-locking” you into their ecosystem and workflows.
As pipelines become more complex and team sizes grow, the price of a license or subscription can become less important compared to other factors that can affect the effectiveness of the CI/CD system:
Statistically, by reordering the build queue and minimizing redundant builds, teams can save at least 30% of the build time and associated costs.
The more tools and services your CI/CD supports out of the box, the less the chance you’ll have to write and maintain custom scripts and external integrations. This can drastically affect maintenance costs.
Additionally, most teams have peak periods (usually during release times) when any failures of the CI/CD tool can significantly impact the company’s business. This is one of the challenges that can hardly be evaluated without having actual experience with a particular CI/CD solution. Still, it is possible to understand how it handles such issues by reading reviews and feedback from other teams regarding work on similar tasks.
Ultimately, the total cost of ownership of a CI/CD solution depends on your team’s specific needs and requirements. As a general rule, it is prudent to consider the following factors:
Integration costs
Integrating CI/CD with version control systems, issue trackers, build and test frameworks, deployment automation systems, and other tools can be very time-consuming and expensive.
Maintenance costs
Every CI/CD solution requires allocating resources for running regular security audits and keeping the underlying infrastructure up to date, diagnosing and eliminating bottlenecks. In many companies, supporting these processes requires an entire team.
CI/CD efficiency
If your builds are constantly sitting in the queue and you are not getting rapid feedback, this defeats the whole purpose of a CI/CD solution. Such features as dynamic scaling in the cloud, re-using of builds, and test parallelization significantly impact developer efficiency in large companies.
Feedback
To achieve efficient and productive software development, it is essential to have a feedback loop that is not only timely but also actionable. When a build fails, developers should quickly identify the root cause of the issue and see a clear path to a resolution. Often, there is an observable time between being notified of a build failure and fully understanding what needs to be fixed – and this is where a reliable CI/CD tool can provide immense value.
By analyzing build logs and providing precise information about the issue, the best CI/CD tools can help developers fix any issues quickly and confidently, leading to faster feedback loops and increased overall productivity.
Factors that reduce TeamCity’s cost of ownership:
Licensing costs
Infrastructure costs
Integration costs
Maintenance costs
Usability and support
Finding the optimal balance between functionality and user experience is a constant challenge for vendors of CI/CD solutions. When evaluating software usability for your team, you should consider the following factors:
UI consistency
As the size of projects increases, it becomes increasingly essential that your CI/CD provides the required functionality without adding unnecessary complexity. When evaluating a solution, ensure that the most critical features are provided by the vendor, not developed by the community.
“One of the competitors had a very unfriendly UI. The feeling that people should have when they come into a CI/CD system is that it is very sturdy; it won’t break when I try to do anything in it. I think TeamCity has a very well-polished UI. You have confidence that it is a well-working system when you navigate it.” – Steve Fortier, Lead Release Engineer, Gearbox
External plugins can often introduce navigation issues, feature an unresponsive interface, have conflicting terms and icons, exhibit difficulty adapting to different screen sizes and devices, and lack proper documentation. Regardless of how experienced your team is, an inconsistent user interface will always result in reduced productivity.
Accessibility
If a CI/CD tool supports accessibility features such as screen reader compatibility, keyboard navigation, and high contrast mode, it’s usually a good indicator that it provides a good experience in general.
Documentation and support
Comprehensive documentation, tutorials, videos, and a supportive community can be essential for effectively using a CI/CD tool. As a rule of thumb, the longer the solution has been available on the market, the higher the chance that you will be able to resolve problems and obtain answers to your questions.
API
Depending on the specific requirements of your team and the workflow you want to implement, you may need to integrate your CI/CD with external tools. This experience can vary widely depending on the maturity of the API, the availability and quality of its documentation, and how rapidly it changes between versions of the software.
An intuitive user interface is vital in a CI/CD solution because it helps developers easily and quickly understand and use the solution, even when working with complex processes.
Example of TeamCity’s UI
Hosting model
CI/CD solutions can be roughly divided into two categories – cloud and on-premises options.
Meanwhile, on-premises CI/CD tools will enable you to host your CI/CD behind the security of your firewall, complying with the strictest security regulations and requirements.
Final thoughts
Choosing a CI/CD tool for your organization depends on many factors. In this blog post, we’ve provided you with the key factors you might want to consider when researching the best fit for your team or organization.
Feel free to share your questions or comments in the section below. We’ll be happy to answer them.
The recently released TeamCity 2023.11 comes with the long-awaited matrix buildfeature. Matrix build is a build that executes the same set of steps on different combinations of input parameters, producing a matrix with the result of every execution. This is a classic approach to testing code changes on different architectures and operating systems.
Matrix builds in TeamCity allow exactly this, while using the Fork-Join pattern under the hood. Let’s see how this works.
Applying the Fork-Join pattern to builds in TeamCity
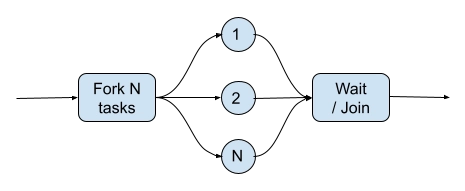
The Fork-Join pattern is a programming technique designed for situations where certain tasks can be done in parallel. You spawn a set of tasks/threads (fork), wait for those tasks/threads to be executed (join), and then combine all the results.
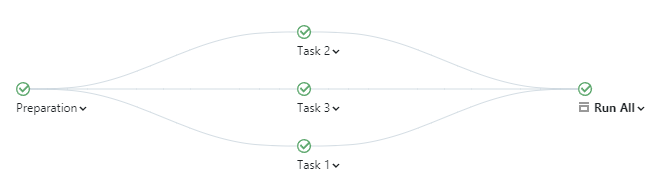
Let’s assume that we’d like to use the same Fork-Join approach for our builds in TeamCity. A natural choice would be to create several build configurations for the parallel activities and add a composite build that would have snapshot dependencies on all these build configurations.
Here the Preparation build prepares something that can be used by the Task builds. Run All is a composite build that waits for all the tasks to finish.
If we’re using the Kotlin DSL, then we can create any number of such build configurations relatively easily. We might end up with something like:
import jetbrains.buildServer.configs.kotlin.*
import jetbrains.buildServer.configs.kotlin.buildSteps.script

version = "2023.11"

project {
   val tasks = mutableListOf<Task>()
   for (num in 1..3) {
       val task = Task(num)
       tasks.add(task)
       buildType(task)
   }

   buildType(RunAll(tasks))
   buildType(Preparation)
}

class RunAll(tasks: List<Task>) : BuildType({
   name = "Run All"

   type = Type.COMPOSITE

   dependencies {
       for (task in tasks) {
           snapshot(task) {}
       }
   }
})

class Task(taskNum: Int) : BuildType({
   id("Task$taskNum")
   name = "Task $taskNum"

   steps {
       script {
           scriptContent = """
               echo "Running Task $taskNum"
           """.trimIndent()
       }
   }

   dependencies {
       snapshot(Preparation) {}
   }
})

object Preparation : BuildType({...})
If we want to use a web interface, we’d probably first create a template and then base our Task build configurations on it. Obviously, using a web interface for setup will involve a lot more clicking, but in the end the result will be the same.
What does this have to do with matrix builds?
Let’s change our Kotlin DSL example by utilizing the matrix build feature:
You can see that our RunAll build configuration is now a normal / non-composite build that has a matrix build feature with a taskNum parameter, and this taskNum parameter is being used in the build step. There are no Task(s) and no snapshot dependencies on them; the only snapshot dependency left is Preparation.
When we trigger RunAll, TeamCity will analyze the matrix feature parameters and will create a new set of builds with the same settings as the triggered one, but each build gets its own value from the matrix parameter. The main build is then transformed into a composite one, and snapshot dependencies are added to the generated builds.
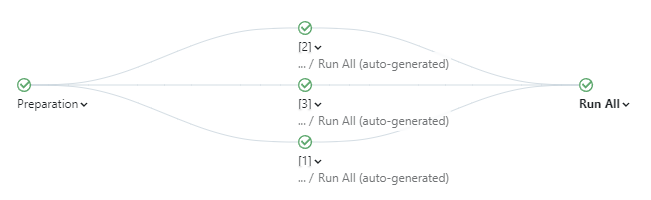
Essentially, the build becomes a build chain that resembles the same Fork-Join pattern:
All we had to do was to add a matrix build with a single parameter with multiple values and make our steps change behavior based on the value of the parameter (which we’d need to do in any case).
Another advantage is that the generated builds are being placed in the auto-generated build configurations, which are not being shown in the normal TeamCity build configuration views. This significantly reduces clutter. You can still navigate to the generated builds using direct links and investigate the build history there.
Since the matrix build is a composite build, all the results are being accumulated and shown in a single place automatically. For instance, if individual builds run tests, then all of them will be visible on the matrix build’s Tests tab. Moreover, if individual builds publish artifacts, the artifacts will also be combined into a single artifact tree and shown in the matrix build.
As you can see, matrix builds can be used to parallelize activities in your builds. For instance, you might want to split a single test suite into several smaller ones. In this case, you can set up a matrix build with a “suite” parameter, whose value might be a list of all these separate test suites. Subsequently, you simply feed this suite parameter value into your build step without generating any extra build configurations and without observing them constantly in the UI.
By the way, if you need to run different build steps depending on matrix build parameters, then you can use conditional steps.
This is a guest article by Kumar Harsh, draft.dev.
If you ship Android app releases frequently, you probably already understand the value of well-defined build, test, and deployment workflows. Without resilient, automated DevOps workflows in place, it can be difficult to maintain a high release velocity. Automating these through continuous integration and continuous deployment (CI/CD) can make your life a lot easier and allow you to detect bugs earlier and release faster.
JetBrains TeamCity is a CI/CD platform for building robust pipelines. It offers seamless integration with popular Android development tools and features a user-friendly interface for configuring build and test stages.
This article will show you how to set up a CI/CD pipeline for your Android project using JetBrains TeamCity. You’ll explore the key components of Android CI/CD pipelines and dive into configuring a few sample pipelines with TeamCity.
Understanding the Android CI/CD pipeline
An effective CI/CD pipeline for Android development contains all of the steps included in a standard DevOps pipeline and augments it with additional processes like artifact signing and auto-deployment to internal tracks on the Google Play Store. Here is a quick overview of all the steps involved in a typical Android CI/CD pipeline:
1. Code checkout and version control integration: The pipeline begins by fetching the latest code changes from your version control system (VCS), such as Git. If you’re using TeamCity, you’ll benefit from its integration with popular version control tools and automatic triggering of pipelines upon code commits or merges.
2. Build automation with Gradle: Gradle, the standard build tool for Android projects, takes center stage in this step. TeamCity executes Gradle commands to compile your code, assemble resources, and generate build artifacts. TeamCity’s build runners provide compatibility with different Gradle versions and customizable environments for build configurations.
3. Unit and integration testing for multiple Android versions/platforms: The next step involves running unit tests that verify individual code modules and integration tests (including UI tests) that check how different components interact. TeamCity allows you to configure multiple test runners and frameworks (e.g. JUnit, Espresso) and execute tests targeting various Android versions and platforms using emulators or device labs.
4. Static code analysis (featuring JetBrains Qodana) and code coverage reporting: Static code analysis helps identify potential bugs, security vulnerabilities, and coding style inconsistencies early on. TeamCity integrates with JetBrains Qodana, a static code analysis tool that offers features like code smell detection, complex code analysis, and integration with various programming languages, ensuring comprehensive code quality checks. Additionally, TeamCity can generate code coverage reports that indicate which parts of your code are exercised by unit tests. This helps developers focus on areas with weak coverage.
5. Artifact generation and signing (APKs and AABs): After successful builds and tests, the next step involves creating deployable artifacts. For Android apps, this typically involves generating signed Android Package Kits (APKs) or Android App Bundles (AABs). TeamCity allows you to automate the signing process within the pipeline using build steps.
6. Deployment to internal testing and production environments (Google Play, beta channels): CI/CD pipelines can automate app deployment to various environments. TeamCity allows configuration for deploying to internal testing platforms or directly to production channels on Google Play.
7. Continuous monitoring and feedback loops: A robust CI/CD pipeline doesn’t end with deployment. TeamCity integrates with monitoring tools, enabling you to track app performance, identify crashes, and gather user feedback. This feedback loop allows developers to react quickly to issues and continuously improve their app’s quality.
Building the pipeline with TeamCity
Now that you’ve explored the general CI/CD pipeline structure, let’s dive into building one using TeamCity. The following sections guide you through setting up TeamCity, creating build configurations tailored to your Android project, integrating automated testing, and finally, configuring packaging and deployment of your app.
To keep things simple, this tutorial uses the cloud-hosted version of TeamCity, which comes with a fourteen-day free trial. You can sign up for it using your GitHub, GitLab, Bitbucket, or Google Account, or by using the old-school combination of your email address and password. Make sure to activate your trial or subscription before moving to the next step.
However, you can also use TeamCity Cloud with self-hosted build agents or even TeamCity On-Premises for the purposes of this tutorial. Keep in mind that using self-hosted build agents or TeamCity On-Premises would require you to install Android SDK on your agents separately.
Setting up TeamCity
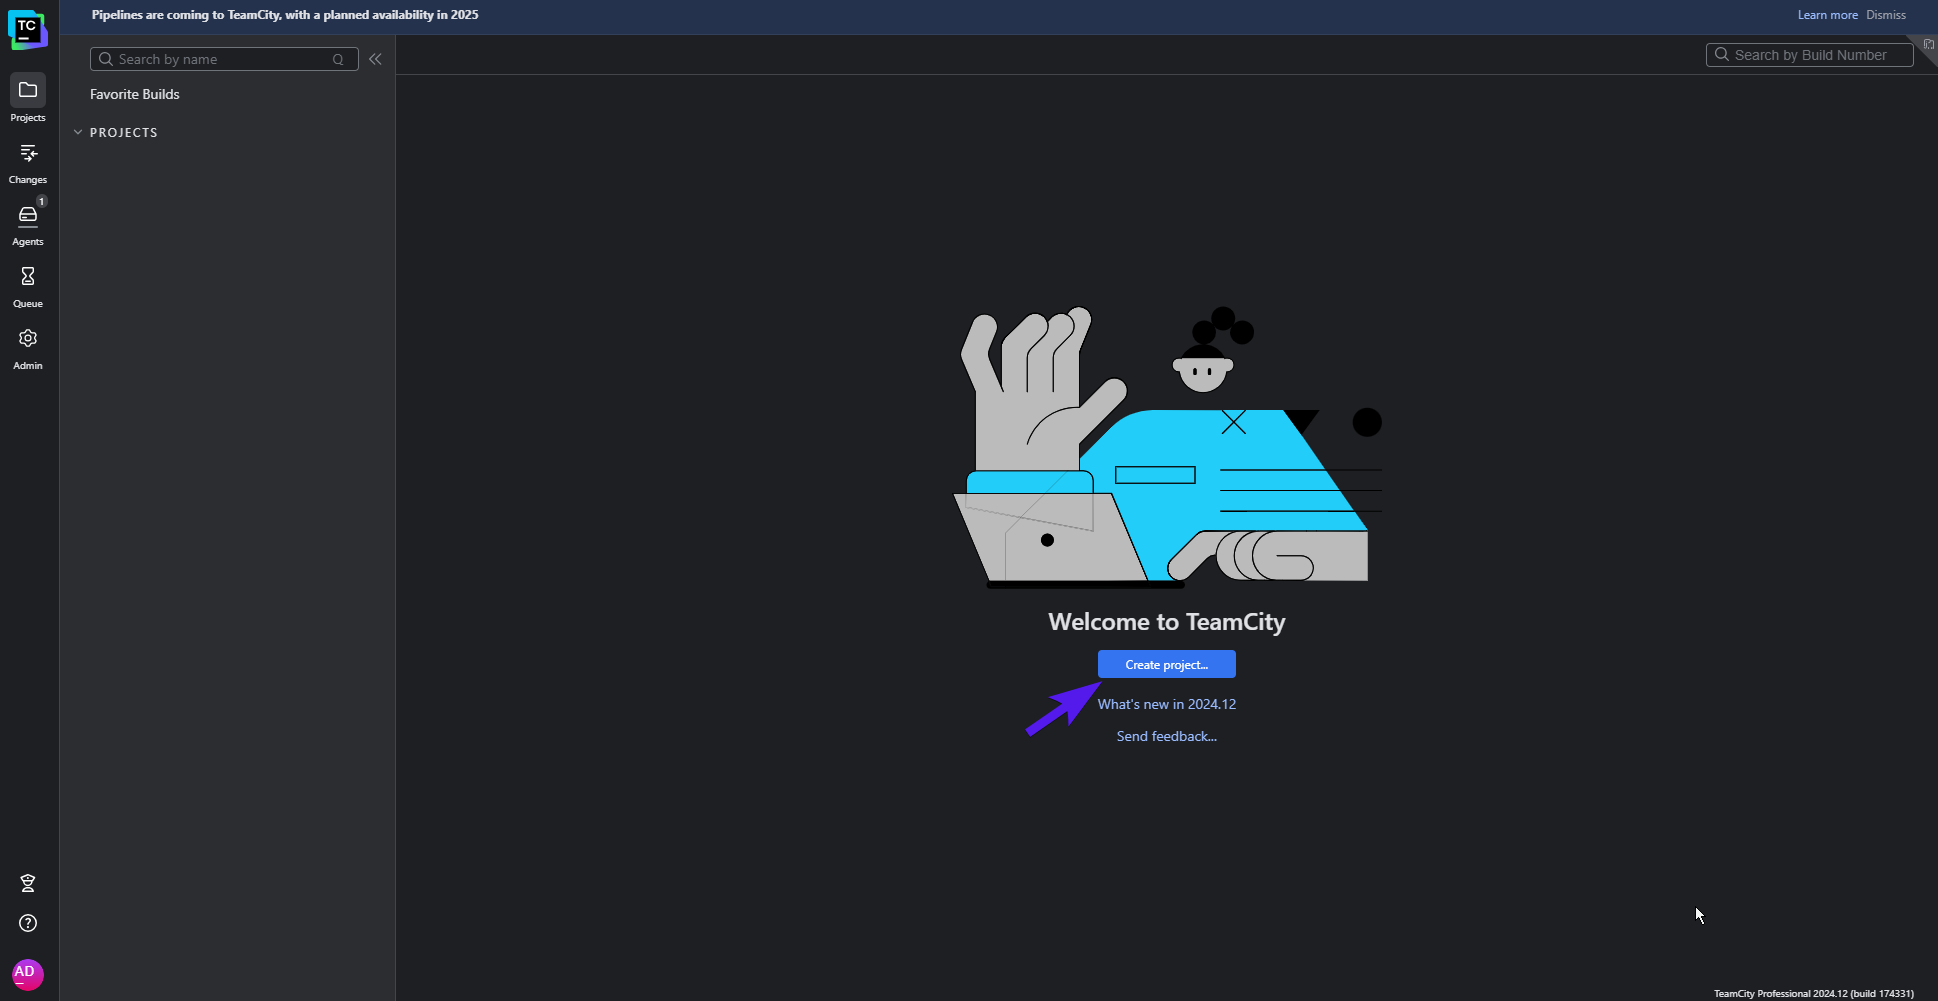
Once you have access to a TeamCity Cloud instance, here’s what your initial view will look like:
TeamCity Cloud dashboard
To get started with an Android project, click Create project… in the middle of the page. Then, you’ll be asked to provide a link to the source code of your project. If you signed up using a Git hosting provider (such as GitHub or Bitbucket Cloud), feel free to check out its corresponding section and use its dedicated project creation process.
However, if you have the repository URL, you can directly use it in the From a repository URL tab. TeamCity will automatically detect the Git hosting provider and pull in your project from there.
Create Project page
If you don’t have an Android project at hand, you can use the following repository to follow the tutorial:
If the repository you’re trying to access is private or secured using a username and password combination, you can provide it here so that TeamCity can access it. Once you’ve entered the repository URL (and any additional details as needed), click Proceed.
On the next page, TeamCity Cloud will verify the connection to the VCS repository. Once it’s successful, TeamCity will pull in some metadata related to the project, such as its name, its default branch, etc. You can modify these values before they are stored in the TeamCity project.
Connection verified when creating project
Once you’re happy with the information on this page, click the Proceed button. TeamCity will then begin to automatically detect any build steps applicable to the repository based on the available configuration files in the repository. Since this repository has Gradle-based configuration files, it will automatically suggest a set of Gradle tasks you can use to build the app from the repository (in this case, clean and build).
Check the box next to the Gradle build step, and click Use selected:
Selecting auto-suggested build steps
Once done, you’ll receive a small banner saying you can now run the first build in the project. Click Run at the top right to start the first build:
Starting your first build
Once you click the button, a build will be queued, which will then wait for a build agent to become available. You can click Projects in the top navigation pane and choose the running build to view its properties and status:
Running build details
The build will be completed in about 5–6 minutes. Congratulations! You’ve set up your first Android CI/CD pipeline with TeamCity. Also, since you used a VCS repository URL to set up this pipeline, it’s been configured to automatically poll the repository URL at fixed intervals to see if any new changes have been pushed to the repo. If new changes are found, the pipeline will automatically pull the latest commit and run the build again.
You can further enhance this by setting up platform-specific webhooks. For instance, the repository you just set up is hosted on GitHub. TeamCity allows you to conveniently install a GitHub webhook so that GitHub automatically sends out a notification to TeamCity every time there is some activity on the repo:
Installing GitHub webhook
You can go ahead and do that if you’d like to. However, it’s not necessary for the purposes of this tutorial.
Configuring build artifacts
The repository you have set up includes two flavors (Free and Paid). For both of these flavors, there are two build variants (debug and release). This means that the result of a build task will include four binary files, one for each of the possible combinations of flavors and variants. Let’s configure the pipeline to extract and make these artifacts available for access after the pipeline has finished running.
To do that, click Projects in the top navigation pane and click Build under Android App Teamcity to open the details page for the build configuration titled Build:
Navigating to build configuration page
Here, click the Edit configuration button in the top right-hand corner of the screen:
Editing your build configuration
This is where you can configure the general settings for your build configuration. You’ll notice there’s a field titled Artifact paths towards the bottom of the list. This is where you need to define the paths of the artifacts that you wish to extract and retain after the build finishes running:
Setting artifact paths
When you run the Gradle build task, the artifacts generated by Gradle are stored in app/build/outputs/apk. Therefore, you need to enter the following under Artifact paths:
app/build/outputs/apk/*/*/* => output
You add /*/*/* after app/build/outputs/apk because the complete path of an APK binary generated after a build looks like this: app/build/outputs/apk/<flavor>/<variant>/app-<flavor>-<variant>-unsigned.apk.
To accommodate all possible values of <variant>, <flavor>, and binary file names, we’ve used the wildcard *.
=> is a feature of Ant-style paths and is used to separate output and input directories. output is the name of the folder in which the final binaries will be stored.
Once you’ve added this, click the Save button at the bottom of the page. You’ll see a yellow banner saying your changes have been saved:
Saving changes made to build configuration
You can now try running the pipeline again using the Run button at the top right of the page to view the generated artifacts after the build is completed:
Viewing the generated artifacts
You’ve now set up a pipeline that’s triggered every time a commit is pushed to the main branch of your repo. This pipeline generates unsigned build artifacts for all flavor-variant combinations in your project, runs unit tests, and makes the build artifacts available for viewing.
Next, you’ll learn how to customize tests.
Customizing tests
As mentioned before, the Gradle task build also takes care of running unit tests on all generated build artifacts. However, there can be situations where you only want to run tests on a few variants of your app. In that case, you need to replace the clean build tasks with the appropriate tasks for your use case.
For instance, if you want to create an unsigned APK for the release variant of the free flavor of the app and run unit tests on it, you would replace clean build with assembleFreeRelease testFreeReleaseUnitTest. To do that, click on Projects in the top navigation pane and then click Build under Android App Teamcity. On the next page, click the Edit configuration button at the top right, just like you did in the previous step.
You should be on the General Settings page for the build configuration, which you accessed earlier to configure the artifacts path. On the left navigation pane, click Build Step: Gradle.
Navigating to build settings
This will open the Build Steps page, where you can modify the build steps for this build configuration. Click Edit on the right side of the first build step (titled Gradle):
Editing Gradle build step
You can now update the Gradle tasks field to change the tasks that will be executed as part of this build. Replace clean build with assembleFreeRelease testFreeReleaseUnitTest:
Updating Gradle tasks
Now, click Save at the bottom. Once the changes are saved, click the Run button at the top right. This will trigger another run of this build configuration.
Once the build finishes running, you can take a look at the reports generated by TeamCity in the Tests tab on the build run details page:
Viewing test results
For each of the unit tests, you can view how long it took to run and if there was any stack trace left after the test was completed. You can also click the three dots on the far right of the test and select Show test history to compare the performance of the current run of the test with its past runs:
Comparing test run history
You can assign the investigation of a test to a team member and track its investigation history through TeamCity itself. If you’d like, you can also download the test results by clicking the Download link on the test overview page.
The number of tests in this repo is quite small, so the build run was completed in a few minutes. However, in a real-world project, there are usually hundreds, if not thousands, of unit tests. In such a situation, running all of these tests on the same runner agent one after another would take a significant amount of time. To solve this, you can use TeamCity’s parallel tests build feature.
TeamCity is capable of parallelizing your test runs by splitting them over multiple build agents, helping you to minimize the overall time it takes to run all the tests. To set this up, click the Edit configuration button on the build run details page and click Build Features on the left navigation pane:
Navigating to the Build Features page
On the Build Features page, click the + Add build feature button. In the dialog box that opens, choose Parallel tests in the dropdown menu:
Searching for parallel tests
You need to enter the maximum number of batches for executing tests in parallel. Enter a value between 4 and 8 to get the maximum benefit from parallelization.
Setting up parallel build batches
Once done, click the Save button. You can now try running tests for a repository that has a larger number of test cases to see the difference in performance for yourself!
Managing multiple builds
Since this app has multiple flavors and variants, it would make sense to make use of the matrix builds offered by TeamCity to speed up build pipelines by splitting each variant-flavor combination into its own run instance. Additionally, this also allows you to build specific combinations of the application without having to necessarily build all or just one variant-flavor combination.
To do this, you need to create a new build configuration. Click Projects in the top navigation pane and click Android App Teamcity. On the project details page, click the Edit project… button in the top right-hand corner:
Navigating to project configuration
On the General Settings page, click the + Create build configuration button under the Build Configurations section:
Creating a new build configuration
This will take you to the Create Build Configuration wizard. Enter the same repository URL as before (https://github.com/krharsh17/android-app-teamcity) in the Repository URL field and click Proceed:
Entering repository URL
Set the Build configuration name on the next page to Matrix Builds, and leave the default values in all other fields. Then, click the Proceed button:
Setting build configuration details
TeamCity will notify you that a similar VCS root has been found. Click the Use this button in this dialog box:
Choosing an existing VCS root
This will ensure that TeamCity polls the VCS URL only once for both of these build configurations to avoid additional performance overhead.
Once the build configuration is complete, you should get a notification confirming it has been created:
New build configuration created
This time, you don’t need to set up the clean build Gradle tasks, so don’t check any boxes on this page. Instead, click the link above the table that says configure build steps manually.
You’ll be taken to the New Build Step page, where you can choose your preferred runner for the build step:
Selecting a build runner
Choose Gradle from this list. On the next page that opens, enter clean test%env.FLAVOR%%env.VARIANT% in the Gradle tasks field:
Entering a Gradle task
This will ensure that the runner first cleans the build folders and then runs the test task for the flavor and variant provided by the environment variables. For example, for the release variant of the free app, the task would be called clean testFreeRelease.
Scroll down and click the Save button. You’ll then be taken back to the Build Steps page:
New build step added
Click the + Add build step button and add another Gradle build step with the task assemble%env.FLAVOR%%env.VARIANT%. This step will generate build artifacts for the given flavor and variant of the app.
Once done, your Build Steps page should list the two Gradle-based build steps you created with a quick summary of the Gradle tasks that will be run as part of them:
Build steps updated
Now, you need to do two more things: define the values for the two environment variables you used and configure artifact paths.
You already know how to set the artifact paths for a build configuration. For this build configuration, set the value of the Artifact paths field to app/build/outputs/apk/*/*/* => output, the same as for the previous one.
To set the matrix values for the flavor and variant fields, click Build Features on the left navigation pane. On the Build Features page, click the + Add build feature button and search for Matrix Build in the dropdown menu in the dialog box:
Searching for Matrix Build on the Build Features page
Once you select the Matrix Build option from the dropdown list, you’ll be asked to provide parameters for the matrix build along with their values. Provide a parameter’s name as env.FLAVOR and its value as Free. Add another parameter, env.VARIANT, with two values: Release and Debug.
Configuring matrix build
Now, click the Save button. This completes the setup of matrix builds on this pipeline. You can try testing it by clicking the Run button in the top right-hand corner of the page.
You’ll now be able to view the results of each run separately, along with separate build artifacts and test results.
Matrix build results
You can click the Dependencies tab to view the build run details for each of the individual runs:
Viewing individual build run details
As you’ve seen before, you can explore each of these entries as a standalone, complete build run.
Packaging and deployment
One key part of an Android CI/CD pipeline is pushing out the release binaries to Google Play so they can be published to users. You can use TeamCity and Gradle Play Publisher (GPP) to automate this as well.
There are a few prerequisites before you start this process:
1. Make sure you have manually uploaded the first APK/AAB for your Android project to Google Play Console.
3. You need to create a service account on Google Cloud Platform to be able to use the Google Play Developer APIs and retrieve its JSON credentials file. To do this, follow these steps before progressing to the next step.
Once you’ve completed the steps detailed in the link above, you need to install and configure GPP in your Android project. To do that, add the following line of code to the plugins block in the app-level build.gradle.kts file:
kt
id("com.github.triplet.play") version "3.9.1"
Then, at the root level of this file, add a new play {} block with the following content:
kt
play {
    serviceAccountCredentials.set(file("play_config.json"))
    track.set("internal")
    releaseStatus.set(ReleaseStatus.DRAFT)
    defaultToAppBundles.set(true)
}
This configures GPP to use the service account credentials from a file named play_config.json, set the track to internal and release status to DRAFT when pushing binaries to Play Console, and use app bundles in place of APKs by default.
This concludes the necessary configuration steps for your Android project. Commit and push these changes to the GitHub repository before proceeding.
You’ll now create a new build configuration for pushing binaries to Google Play in TeamCity. Follow the same steps as before to create a new build configuration. Set the first build step to use Gradle as the runner and bundleFreeRelease as the Gradle task to run:
Build steps
Add another step to this build configuration, but choose Command Line as the build runner this time:
Configuring a new command line build step
The new build step page for the command line runner will open. You need to provide the custom script that signs and publishes the app bundle to Google Play. Enter the following code in the Custom script field:
# Create the keystore file from the environment variables
echo %env.ANDROID_KEYSTORE_FILE% > keystore.jks.b64
base64 -d -i keystore.jks.b64 > app/keystore.jks

# Sign the AAB using the keystore and credentials retrieved from the environment variables
jarsigner \
-keystore app/keystore.jks \
-storepass %env.KEYSTORE_STORE_PASSWORD% \
-keypass %env.KEYSTORE_KEY_PASSWORD% \
-signedjar release.aab \
app/build/outputs/bundle/freeRelease/app-free-release.aab \
%env.KEYSTORE_KEY_ALIAS%

# Create the GCP service account credentials file from the environment variables
echo %env.PLAY_CONFIG_JSON% > play_config.json.b64
base64 -d -i play_config.json.b64 > app/play_config.json

# Use GPP to publish the app bundle
./gradlew publishFreeBundle --artifact-dir release.aab
The code has inline comments to explain what each line does. Once done, click the Save button at the bottom of the page:
Configuring your command line script
You also need to define the following environment variables to provide the script with the right credentials to sign and publish the app:
Click Parameters in the left navigation pane to go to a page where you can define these environment variables. You’ll see that TeamCity has already populated the list of required variables on this page for you:
Viewing newly recognized environment variables
For KEYSTORE_KEY_ALIAS, KEYSTORE_KEY_PASSWORD, and KEYSTORE_STORE_PASSWORD, feel free to click Edit and provide their values in the resultant dialog boxes:
Configuring environment variables
For ANDROID_KEYSTORE_FILE and PLAY_CONFIG_JSON, you first need to convert the files into Base64 using a tool like openssl, and then paste the Base64-encoded contents into the value fields of these variables.
This sets up the pipeline to build and publish a signed release of the free version of your application. You can try clicking the Run button at the top right of the page to trigger a run and see it in action.
Once the run succeeds, you’ll see a BUILD SUCCESSFUL message in the logs:
Successful build result logs
And here is the latest release of your app, available on the internal track in Google Play Console and ready for you to edit and promote:
Play Console internal testing page
You’ll notice that the new release has the same developer-facing name (“2.0”) as the previous one. This is because no name was specified in GPP’s configurations. You can take a look at the GPP documentation to learn how to do that yourself.
Best practices and tips
Now that you can set up your own pipeline for Android using TeamCity, here are a few key best practices you can consider implementing to ensure your pipelines are efficient and fast:
1. Version control and versioning practices: An effective CI/CD pipeline strongly depends on a robust version control system (VCS) like Git. Ensure your team adheres to clear versioning practices and implements a consistent branching strategy (e.g. feature branches). Develop customized pipelines for different branches to ensure you aren’t running unnecessary steps on WIP code, for instance.
2. Clear pass/fail criteria and thresholds: Clearly define what constitutes a successful build and test run. This can involve setting thresholds for unit test coverage, getting a green light on other code checks, and so on. You should configure TeamCity with pass/fail criteria for each stage of the pipeline to ensure robust builds and encourage developers to write better code.
3. Leveraging TeamCity notifications and alerts: TeamCity offers a detailed notification system to help notify users about pipeline events across web browsers, email, Slack, and IDEs. Make sure to set up alerts for build failures and critical test failures to keep your development team informed and allow for prompt issue resolution.
4. Collaboration and feedback loop: An effective CI/CD pipeline fosters collaboration within your development team. You should use build pipeline visualization within TeamCity to provide developers with a clear picture of the entire build and test process. You can also use test and build investigations to assign and collaborate on investigations into why a build or a test failed, right within TeamCity. Also, encourage team members to review build failures and code coverage reports to identify areas for improvement. This can help develop a culture of code quality and continuous improvement.
5. Security measures (code signing and access control): Make sure to configure your TeamCity instance with proper access controls, restricting access to sensitive information like signing keys to only those users who need access to the information. You should consider using a tool like HashiCorp Vault to manage and rotate all sensitive credentials that you might be using in your builds. You can check out a few other key security recommendations from TeamCity here.
Conclusion
In this article, you learned how to build and manage a detailed CI/CD pipeline for your Android development projects using JetBrains TeamCity. You explored the key stages of an Android CI/CD pipeline, from code checkout and version control integration to signing, deployment, and monitoring. You learned how TeamCity facilitates each stage and streamlines your development workflow. Toward the end, you also learned some key best practices to ensure your pipeline operates efficiently.
By using TeamCity to set up your Android pipelines, you can make your workflows significantly more efficient. This directly results in faster release cycles, fewer bugs, and ultimately, high-quality Android apps, delivered efficiently. So, take the first step towards a more streamlined development process, and start building your CI/CD pipeline today!
This article was brought to you by Mdu Sibisi, freelance writer, draft.dev.
Cloud technology has reshaped how developers manage and deliver software. For example, “serverless computing” allows a provider to dynamically manage the allocation and provisioning of servers for you, which makes it ideal for running microservices.
When paired with CI/CD practices, serverless computing can help shorten development cycles, reduce the incidence of errors, and increase the scalability of pipelines.
However, it does present some unique challenges, such as achieving comprehensive visibility, establishing secure and compliant interservice communication, and managing deployment and versioning. Many of these obstacles can be overcome using a tool like JetBrains TeamCity to integrate CI/CD with serverless computing.
This guide explores the best practices for microservice management through CI/CD integration on serverless computing and how TeamCity can simplify the process.
Modular design for microservices
When building microservices for serverless architecture, you should adopt a modular design to optimize compatibility with CI/CD pipelines. While alternatives like monolithic architecture, service-oriented architecture (SOA), and micro-frontend architecture each have their merits, they often introduce complexity and overhead. Modular design, on the other hand, allows you to create flexible, efficient microservices that align with serverless computing.
Modular design allows you to break an application down into smaller, independent components or microservices. A good example is how streaming services use dedicated modules or microservices for each major component, including user authentication, content management, recommendation systems, and billing.
This approach improves each component’s scalability, cost efficiency, flexibility, resilience, and maintainability.
Single responsibility principle (SRP)
Regardless of the use case, it’s crucial that your microservices align with the single responsibility principle (SRP), which states that each microservice should have a clearly defined purpose or responsibility that focuses on a specific business or usage function. This makes them easier to manage, debug, and troubleshoot.
High cohesion
To effectively implement SRP, microservices should be highly cohesive, with components closely related and working together. This improves maintainability, reduces complexity, and allows for focused testing, as each module can be tested in isolation.
Loose coupling
Loose coupling, or decoupling, means that alterations or changes in one microservice should not significantly affect another. It allows for independent development, deployment, and scaling of each service, which can often be challenges associated with running microservices on serverless architecture. Updates or changes to one module can be deployed without taking down the entire application, reducing downtime and improving availability.
Decoupling can make dependency mocking or stubbing simpler and enable you to thoroughly test each module’s functionality without relying on other services.
API-first design
To enhance cohesion and reduce coupling, adopt an API-first approach to microservice design. This involves creating a well-defined API before developing other components, which should provide consistent communication, smooth interoperability, and simplified integration. It also streamlines documentation and monitoring.
Automating builds and deployments
Automated pipelines make it easier to handle multiple microservices. You can use them to manage the build and deployment of multiple microservices simultaneously. These pipelines can also scale in response to increased demand, helping build and deployment processes remain efficient even as the number of microservices grows.
While you can write scripts and develop your own background services to manually build your pipelines, it would be far easier and more efficient to employ a tool like TeamCity, which provides a flexible, all-in-one solution to build, test, and automate deployment.
It offers multiple configuration options (most notably configuration as code) and templating. Alternatively, you can use one of TeamCity’s SaaS implementations for a web-based wizard that allows you to initialize and edit your pipelines visually.
TeamCity Pipelines interface
Version control and management
You also need a way to manage versions of serverless functions and microservices to maintain stability, backward compatibility, and smooth deployments. There are two main versioning strategies to consider:
Semantic versioning is used to indicate major, minor, and patch changes. It makes it easier to identify the impact of changes and manage dependencies.
API versioning allows you to manage changes in the API contract. You can use URL versioning (such as /v1/resource), header versioning, or query parameter versioning.
Each version of your serverless functions and microservices should be accompanied by clear and comprehensive documentation.
This must include API endpoints, request-response formats, and any changes introduced in each version. In addition, it’s important to keep a detailed changelog to track changes, bug fixes, and new features for each version. This helps developers understand the evolution of the service.
It’s good practice to ensure that your microservices are backward compatible. This helps prevent changes from breaking existing clients.
Despite your best efforts, things may still go wrong. So, establishing rollback mechanisms is important. They enable quick recovery from deployment failures by swiftly reverting to a stable version. Additionally, they give teams the confidence to experiment with new features or changes to their microservices while knowing they can easily revert if something goes wrong.
Testing strategies for serverless microservices
Testing serverless microservices can be extremely challenging due to their ephemeral nature, event-driven architecture, and distributed systems. These factors make it difficult to reproduce and debug errors, simulate events accurately, and test interactions between services.
Additionally, maintaining consistent performance, security, and compliance across multiple third-party services adds complexity. However, there are tailored strategies and tools you can adopt to help improve the quality and reliability of serverless microservices.
Unit testing
This type of granular testing focuses on assessing whether individual functions or components perform as expected in isolation. Available frameworks include Jest (JavaScript), pytest (Python), and JUnit (Java). Mocking and stubbing frameworks allow you to simulate external services and dependencies.
For instance, you can stub out external API calls and dependencies to control their behavior during testing. This helps in creating predictable and repeatable test scenarios. In addition, it’s important to write tests for all possible input scenarios.
Integration testing
Integration testing examines the interactions between different microservices and components to check that they work together correctly. Examples of available tools include Postman for API testing or integration testing frameworks like TestNG (Java) and pytest (Python).
Use integration testing to assess the communication between services, including API calls, message queues, and data stores. You can also use it to ensure data consistency and correct handling of edge cases.
End-to-end testing
End-to-end (E2E) testing involves validating the entire application workflow from start to finish to confirm that it meets business requirements. Available tools include Selenium, Cypress, and TestCafe.
You can use these tools to simulate real user scenarios and interactions, which can be crucial in making sure your serverless microservices function as they should. Fundamentally, E2E testing should be used to test the complete workflow, including authentication, data processing, and the user interface.
Simulate serverless environments
In addition to using the above approaches, it’s important to create staging environments that closely mirror your production environments. Once you establish your staging environment, deploy your serverless functions to it. You can further optimize and speed up testing by automating your staging environment integration tests.
Infrastructure as code (IaC)
IaC allows developers to define infrastructure configurations in code, which can be version-controlled and integrated into CI/CD workflows. This includes resources like serverless functions, databases, and networking components.
The typical workflow for using IaC for your infrastructure is as follows:
IaC implementation diagram
Code commit: Developers commit changes to the IaC configuration files in the version control system.
CI pipeline: The CI pipeline is triggered, running automated tests to validate the IaC code.
Approval: Once the tests pass, the changes are reviewed and approved.
CD pipeline: The CD pipeline is triggered, deploying the serverless infrastructure changes to the staging environment.
Testing: Automated tests are run in the staging environment to check that the changes work as expected.
Promotion: If the tests pass, the changes are promoted to the production environment.
Monitoring: The deployed infrastructure is monitored for performance and health, with automated alerts set up for any issues.
Manually integrating IaC with CI/CD pipelines can require significant effort and be time-consuming, especially for serverless infrastructure. This is another area where a tailored solution like TeamCity can help.
You can use it to automate builds and deployments to ensure consistent validation and packaging of IaC configurations. With support for AWS CloudFormation and Terraform, TeamCity automates resource and application deployments, enabling efficient and reliable serverless infrastructure management.
Implementing CI/CD for serverless applications comes with its own set of challenges. The following sections cover some key challenges and how they can be addressed.
Latency related to cold starts
Serverless functions can experience latency during cold starts, which happens when they are invoked after a period of idleness. This increased latency, caused by the cloud provider provisioning necessary resources, can affect the performance and responsiveness of serverless applications, particularly in CI/CD pipelines with rapid and frequent deployments.
Some strategies you can use to address these issues include:
Using provisioned concurrency: Pre-warm a set number of function instances so they are always ready to handle requests without delay.
Preparing event-driven warmups: Use scheduled events to periodically invoke functions, keeping them warm and reducing cold start latency.
Optimizing function code and dependencies: Simplify function code, minimize dependencies, and use lightweight frameworks to reduce initialization time. For instance, remove unnecessary libraries and optimize code for faster startup times.
Choosing an optimal language and runtime: Select programming languages and runtimes with faster cold start times. Languages like Python, Go, and Node.js typically have shorter cold start times compared to Java or .NET.
Increasing memory allocation: Allocating more memory to functions can reduce initialization time, as more resources are available for execution.
Implementing predictive pre-warming: You could implement schedulers that determine the optimal number of instances to pre-warm based on predicted demand. This helps maintain a balance between resource utilization and latency reduction.
Using pre-warmed containers: Containers can be pre-warmed and kept running, reducing the cold start latency compared to traditional serverless functions. You can use AWS Fargate, Azure Container Instances (ACI), and Kubernetes with serverless frameworks to integrate containers with serverless architecture.
These strategies can minimize the impact of cold starts in serverless applications, leading to better performance and responsiveness in your CI/CD pipelines.
Dependency management
Managing dependencies for each microservice can be complex, especially when different services require different versions of the same library. Dependency management tools like npm (Node.js), pip (Python), and Maven (Java) can be used to give each microservice its own isolated environment to avoid conflicts.
Serverless functions often have deployment package size limits, which can be exceeded by large dependencies, causing deployment failures. To avoid this, optimize dependencies by including only essential libraries. Tools like webpack and Rollup can bundle and minify code, effectively reducing package size.
Dependencies can also introduce security vulnerabilities if not properly managed and updated. It’s important to regularly scan dependencies for vulnerabilities using tools like Snyk or OWASP Dependency-Check. Keep dependencies updated and apply security patches promptly to mitigate potential threats.
Environmental parity is another challenge you’re likely to run into. Ensuring that dependencies are consistent across development, staging, and production environments can be difficult.
You can use IaC to define and manage environments consistently. You can also use containerization to create a consistent runtime environment.
Observability and monitoring
Logging and monitoring are critical components of serverless architectures. They provide visibility into the performance, health, and behavior of serverless applications, enabling developers to maintain reliability, security, and efficiency. However, there are some challenges associated with logging and monitoring in serverless architecture.
For instance, because serverless functions are continuously changing, it can be difficult for observability and logging tools to capture and retain logs and metrics. Centralized logging solutions like Amazon CloudWatch, Azure Monitor, and Google Cloud’s operations suite can aggregate logs and metrics from all functions.
Serverless applications often consist of numerous microservices and functions, making it challenging to track and correlate logs across different components. You can address these shortcomings by implementing distributed tracing tools like AWS X-Ray, Azure Application Insights, or Google Cloud Trace to trace requests across multiple services and functions.
As serverless applications can scale rapidly, they generate a large volume of logs and metrics that can be difficult to manage and analyze. As such, administrators must use scalable logging and monitoring solutions that can handle high volumes of data. Implement log retention policies and use log aggregation tools to manage and analyze logs efficiently.
You can use CI/CD to feed data to monitoring systems. However, this can be challenging, especially when dealing with multiple environments and stages. It’s best to automate the setup and configuration of logging and monitoring as part of the CI/CD pipeline. IaC supports consistent configuration across environments.
It can be daunting to get all these moving parts and configurations to work together smoothly. In such instances, it’s always a good idea to use a single unifying tool to handle your IaC, microservice, and CI/CD pipeline management.
How TeamCity supports CI/CD for serverless microservices
As we already mentioned, TeamCity is a powerful CI/CD tool that can significantly streamline the process of managing serverless applications. Let’s look at a few ways it can help.
Pipeline configuration made simple
TeamCity’s visual editor provides an intuitive, drag-and-drop interface for configuring CI/CD pipelines. Changes made in the visual editor are instantly reflected in the YAML editor and vice versa.
TeamCity Pipelines interface
Along with the visual editor’s smart suggestions, the open terminal allows for easier troubleshooting and debugging. You can import existing YAML files from their repositories to make creating your pipeline easier.
TeamCity also offers robust support for IaC tools and deployment triggers. It integrates with AWS CloudFormation, Terraform, and the Serverless Framework. In addition to this, TeamCity offers a large variety of build triggers, including version control system (VCS), schedule, and dependency triggers.
The basic YAML configuration for a VCS trigger in TeamCity typically follows this structure:
The vcs section defines the version control settings, including the repository URL and the branch to monitor. The steps section defines the build and deployment steps using Gradle. The triggers section defines a VCS trigger that initiates the build and deployment process whenever there is a commit to the main branch. Any changes committed to the main branch will automatically trigger the build and deployment process in TeamCity.
Testing and feedback integration
TeamCity offers support for a variety of testing frameworks. This includes common unit testing, integration testing, and E2E testing frameworks. TeamCity can run these tests in cloud-based environments, ensuring your serverless functions are tested in conditions that closely resemble production.
Additionally, TeamCity allows you to run tests in parallel, which can be especially useful for large projects with extensive test coverage. The platform’s real-time notifications inform you of your build or test status through channels like email, Slack, and webhooks.
Flexibility and scalability
TeamCity’s distributed build agents allow it to facilitate flexible and scalable infrastructure and workflows. For instance, you can configure elastic build agents that can be dynamically provisioned and de-provisioned based on workload. This allows the system to scale up to handle peak loads and scale down during off-peak times, optimizing resource usage and cost.
By using multiple build agents, the platform can make sure that the failure of a single agent does not disrupt the entire CI/CD pipeline. Other agents can take over the tasks, maintaining the continuity of the build process. TeamCity can automatically detect and recover from agent failures, restarting builds on available agents and minimizing downtime.
But how does a typical deployment look in TeamCity? What makes it any different than setting up or creating your own system?
Deploying a serverless microservice
Developing your application using microservices already requires a lot of cognitive overhead. Setting up a system to deploy it on serverless architecture shouldn’t be as energy-consuming.
TeamCity is relatively easy to set up. You can build, test, and deploy a serverless application using the following steps:
In TeamCity, create a new project for your serverless application.
Connect your project to a VCS to track your code changes.
Add build steps to compile your serverless application. For example, if you’re using the Serverless Framework, you might add a step to run serverless package.
Ensure that all dependencies are installed. For Node.js applications, you might add a step to run npm install.
Add build steps to run unit tests using your preferred testing framework (such as Jest, Mocha, or pytest).
Add steps to run integration tests to check that different components of your application work together correctly.
Add steps to run end-to-end tests to validate the entire application workflow.
Add build steps to deploy your serverless application. For example, if you’re using the Serverless Framework, you might add a step to run serverless deploy.
Configure environment variables required for deployment, such as AWS credentials or API keys.
Configure VCS triggers to automatically start the build and deployment process whenever changes are committed to the repository.
Monitor the build and deployment process in real time through the TeamCity interface.
Review detailed test reports to identify and fix any issues.
Check deployment logs to confirm the application was deployed successfully.
Emerging trends in CI/CD for serverless microservices
Advancements in CI/CD for serverless microservices are shaping the future of software development. Two of the key emerging trends in CI/CD are event-driven pipelines for automation and AI.
Event-driven CI/CD pipelines enhance the efficiency and responsiveness of the software development lifecycle. These pipelines react to specific events, such as code changes, feature requests, or system alerts.
For instance, triggers can come in the form of HTTP requests made to specific endpoints. In cases where an external system or service needs to initiate a build or deployment, it can send a request to the CI/CD pipeline’s API endpoint. TeamCity is well equipped to manage event-driven workflows, enhancing the automation and responsiveness of CI/CD pipelines.
AI is also revolutionizing CI/CD pipelines by introducing advanced optimization techniques that enhance efficiency, reliability, and speed. AI algorithms in predictive build optimization analyze historical build data to predict the likelihood of build failures. When used appropriately, it can improve overall resource utilization.
In addition to the above, AI can make software testing more robust and reliable. TeamCity can be integrated with AI-powered tools that can analyze code quality and suggest improvements. One example of such a tool is SonarQube, which can perform static code analysis and provide code improvement suggestions through its AI Code Fix tool.
Conclusion
Aligning CI/CD practices with serverless computing can help you optimize the microservice deployment. However, it does present some unique challenges, which can be overcome by following the best practices highlighted in the above guide. Tools like TeamCity make it far easier and more manageable to implement these strategies and practices.
The platform offers 14-day trials for its SaaS implementations and a 30-day trial for its On-Premises Enterprise edition. Once you’ve decided on an implementation, learn how to configure your serverless CI/CD pipeline using configuration as code through Terraform or learn how to integrate it with Kubernetes.
TeamCity is a flexible solution that makes configuring and managing CI/CD in serverless environments easier.
코드는 다양한 유형의 여러 버전 관리 시스템(VCS)에 분산시켜 놓거나 단일 저장소에 둘 수 있습니다. Maven 패키지 또는 Docker 컨테이너와 같은 외부 종속성이 업데이트될 때마다 애플리케이션을 다시 빌드하고 다시 배포해야 할 수도 있습니다.
CI/CD 도구가 특정 변경 워크플로를 잘 지원해주는지 주의 깊게 평가하면 도구가 팀에 적합한지 확인하고 자체 프로세스를 변경해야 할 필요성을 최소화할 수 있습니다.
Docker 및 비 Docker 워크플로
Docker는 다양한 유형의 애플리케이션을 빌드하는 데 편리하고 효율적인 접근 방식을 제공할 수 있지만 실제 OS에서 실행해야 하는 상황도 있습니다. 예를 들어, 애플리케이션이 Docker 컨테이너에서 액세스할 수 없는 하드웨어 구성 요소와 통합되어야 하는 경우 OS 기반 워크플로가 필요할 수 있습니다.
마찬가지로, 시스템 드라이버나 Windows 서비스를 개발할 때와 같이 소프트웨어에 OS와의 상호 작용이 필요한 경우 Docker 기반 워크플로는 팀의 요구 사항을 충분히 충족하지 못할 수 있습니다.
팀에 가장 적합한 CI 도구를 선택할 때는 고유한 프로젝트 요구 사항을 평가하고 두 접근 방식의 장점과 한계를 고려하세요.
팀 성숙도
지속적 통합의 여정을 막 시작한 팀은 특정 솔루션에 맞게 워크플로를 조정하는 데 더 유연할 수 있습니다. 따라서 구성 가능한 옵션이 적은 도구가 더 간소하고 능률적인 사용자 경험을 제공할 수 있습니다.
반면, 해당 요구 사항을 정확하게 이해하고 있는 고도로 숙련된 팀에게는 포괄적인 DevOps 플랫폼이 제한적일 수 있습니다. 이러한 솔루션은 필요한 수준의 유연성과 맞춤화를 제공하지 못할 수 있기 때문입니다.
마이그레이션의 용이성
새로운 CI/CD 도구를 선택할 때 중요하게 고려해야 할 사항 중 하나는 마이그레이션의 용이성입니다. 많은 경우에 완전한 DevOps 플랫폼보다는 독립형 솔루션으로 마이그레이션하는 것이 더 간단할 수 있습니다. 이렇게 하면 사용자가 일괄적으로 마이그레이션할 수 있고, 수작업으로 작성해야 하는 통합 코드가 줄어들며, 개발 워크플로의 중단이 최소화됩니다.
조직 관련 측면
특히 팀에서 자체적으로 자체 개발 도구를 선택할 수 있다면, 조직의 문화와 정책을 고려하는 것이 중요합니다.
일부 팀원은 워크플로의 변화에 저항감을 나타낼 수 있으며, 특히 현재 도구가 익숙하고 편하다면 더욱 그러할 것입니다.
TeamCity의 개발 워크플로 지원
TeamCity는 다음 워크플로에 매우 적합합니다.
여러 VCS 지원
커밋하지 않고 CI/CD 프로세스 실행 가능
변경 사항을 세부적으로 제어(브랜치, 사용자 이름, 파일 마스크 등을 기준으로 필터링)
트리거가 정의된 매개변수
다른 도구와 통합할 수 있는 포괄적인 API
플랫폼의 간소화된 경험과 독립형 도구의 유연성 중에서 하나를 선택하는 것이 까다로울 수 있지만, 다행인 점은 둘 중 하나가 반드시 다른 하나를 사용하는 데 방해가 되지는 않는다는 것입니다.
팀에서 여러 CI/CD 도구를 동시에 사용하는 것이 일반적이므로 적절한 통합이 이루어지기만 한다면 독립형 솔루션과 포괄적인 DevOps 플랫폼을 함께 사용할 수도 있습니다.
파이프라인 구성
모든 팀에는 고유한 워크플로와 요구 사항이 있으므로 이러한 요구를 완벽하게 충족하는 맞춤형 솔루션을 사용하는 것이 중요합니다. CI/CD 도구를 선택할 때 고려할 수 있는 다양한 유형의 파이프라인 구성을 소개합니다.
UI 및 코드 기반 구성
일부 도구는 쉽게 시작하고 설정을 간편하게 유지 관리할 수 있는 UI 기반 구성 방식을 제공하여 특별한 지식 없이도 파이프라인을 구성할 수 있게 해줍니다.
수많은 도구가 간단한 앱의 빌드와 테스트를 쉽게 자동화할 수 있게 도와주는 YAML 구성을 사용합니다. 그러나 팀과 인프라가 더욱 복잡해짐에 따라 YAML 파일을 관리하기가 점점 더 어려워질 수 있습니다.
대규모 프로젝트의 경우 루프, 조건문 및 기타 언어 구문을 지원하는 완전한 프로그래밍 언어를 사용하여 CI/CD를 구성하는 것이 더 효과적일 수 있습니다. 또한 IDE에서 구성 코드를 쉽게 작성하고 리팩터링 및 디버그 기능을 활용할 수 있습니다.
워크플로 사용자 지정
사용자 지정은 팀의 특정한 빌드 및 배포 워크플로와 일치하는 파이프라인을 생성할 수 있게 해주므로 지속적 통합 및 지속적 전달 소프트웨어를 선택할 때 중요하게 고려해야 하는 측면입니다.
코드 커밋, 종속성 업데이트 또는 예약된 트리거와 같은 트리거 이벤트에 따라 팀은 빌드 환경, 테스트 범위, Docker 이미지 태그 및 기타 파이프라인 구성 요소를 사용자 지정할 수 있습니다.
동일한 빌드 에이전트에서 특정 단계를 순차적으로 실행해야 하는 경우(예: Windows 서비스를 시작한 다음 동일한 시스템에서 빌드를 실행하려는 경우) 필요에 따라 이를 정확하게 설정할 수 있는 도구를 선택해야 합니다.
환경 구성
CI/CD 도구를 선택할 때 환경 구성의 측면에서 제공되는 사용자 지정의 수준을 고려하는 것이 중요합니다. 특히, 팀은 Docker 컨테이너, 클라우드 빌드 에이전트, 베어메탈 서버 또는 하이브리드 옵션 중 무엇을 사용하든 요구 사항에 가장 적합한 빌드 환경을 선택할 수 있어야 합니다.
위의 확장성 섹션에서 설명한 바와 같이, 팀이 빌드를 더 빠르게 완성하고 피드백 루프를 단축하는 데 도움이 될 수 있는 다양한 최적화 기술이 있습니다.
중요한 최적화 기술 중 하나는 종속성을 캐시 처리하는 것입니다. 이 기술은 빌드가 실행될 때마다 종속성을 다운로드하고 설치할 필요가 없도록 하여 빌드 시간을 최소화시킵니다. 또한, 이전에 빌드된 구성 요소를 후속 빌드에서 재사용할 수 있는 빌드 아티팩트의 재사용도 빌드 시간을 더욱 줄이는 데 보탬이 될 수 있습니다.
여러 빌드 에이전트에 걸쳐 테스트를 병렬화하는 것도 대규모 프로젝트에서 파이프라인을 최적화하는 또 다른 효과적인 방법입니다. 여러 빌드 에이전트에 테스트를 분산함으로써 팀은 모든 테스트를 실행하는 데 필요한 시간을 줄여 피드백 루프를 단축하고 문제를 더 빠르게 확인하여 해결할 수 있습니다.
💡병렬 테스트는 TeamCity를 개발하고 테스트하는 방식에 혁신을 가져왔습니다. 자체 통합 테스트 시간이 4시간에서 약 20분으로 10배 이상 단축되었습니다.
아티팩트 관리
아티팩트를 생성하고 전파하는 일은 모든 CI/CD 파이프라인에 필수 불가결합니다. 아티팩트를 사용하면 빌드가 서로 ‘소통’하고 한 빌드에서 다른 빌드로 데이터를 전달할 수 있습니다.
아티팩트를 저장할 수 있는 도구를 선택하면 빌드에서 생성된 데이터를 저장하여 후속 분석과 디버그를 수행할 수 있습니다.
피드백 및 분석
CI/CD의 주된 목적은 소프트웨어 변경 사항에 대한 피드백을 받는 데 걸리는 시간을 줄이는 것입니다. 가장 실효성 있는 피드백은 특정 코드 변경과 직접적으로 연결되어 빌드 및 배포 상태는 물론 성능과 품질 메트릭의 변경에 대한 정보를 제공하는 피드백입니다.
CI/CD 솔루션을 평가할 때 다음 측면을 고려해야 합니다.
빌드 결과 분석
CI/CD 솔루션은 실패한 테스트, 빌드 시간, 오류 로그 및 기타 주요 지표에 대한 정보를 포함하여 빌드 결과에 대한 상세한 분석을 제공해야 합니다. 이러한 정보는 쉽게 액세스할 수 있어야 하고 개발자가 문제를 신속하게 식별하고 해결할 수 있는 방식으로 제공되어야 합니다.
트렌드
팀이 시간에 따른 빌드 및 배포 성과의 변화 추이를 추적할 수 있도록 트렌드 분석 기능을 제공하는 도구가 필요합니다. 이를 통해 팀은 패턴과 트렌드를 확인하고 잠재적인 문제가 더 심각해지기 전에 해결할 수 있습니다.
성능 모니터링
병목 현상을 식별하고 CI/CD 프로세스의 효율성에 영향을 미치는 문제를 해결하려면 빌드 에이전트의 성능 특성을 파악하고 빌드 인프라에 더 많은 리소스를 프로비저닝해야 할지 여부를 확인할 수 있어야 합니다.
CI/CD 도구는 버전 관리 시스템 및 이슈 트래커와 통합함으로써 피드백 제공의 기회를 더 넓게 열어줍니다.
불안정한 테스트 탐지
지속적 통합 도구에서 불안정한 테스트를 분석하고 탐지할 수 있는 것이 중요합니다. 피드백 루프를 단축하고 개발 프로세스의 속도를 높이려면 불안정한 테스트를 식별하고 테스트 결과에서 강조 표시해줄 수 있는 도구를 찾으세요.
확장성 및 유지관리
소프트웨어 프로젝트는 규모와 복잡성이 커지는 경향이 있습니다. 안정적인 CI/CD 시스템은 이러한 성장을 수용하고 파이프라인, 빌드, 사용자, 역할 및 워크플로 수의 증가에 보조를 맞출 수 있어야 합니다.
팀 작업에 걸림돌이 생기지 않도록 시스템은 리소스를 효율적으로 관리할 수 있어야 할 뿐만 아니라, 발생하는 모든 문제를 신속하게 해결할 수 있는 모니터링 및 유지 관리 도구를 갖추고 있어야 합니다.
다음 요소를 고려하면 팀에 필요한 확장성 수준을 쉽게 알 수 있습니다.
사용자 관리
소규모 프로젝트에서는 일반적으로 빌드를 트리거하고, 빌드 결과를 확인하고, 파이프라인 구성을 수정할 수 있는 사람을 정의하는 기본적인 역할 기반의 액세스 규칙만으로 충분합니다. 대규모 팀에는 LDAP 통합 또는 싱글 사인온(SSO) 지원, 2단계 인증, 프로젝트 계층 구조, 세분화된 권한 관리, 승인 워크플로 및 감사와 같은 고급 기능이 필요합니다.
커밋 빈도가 증가하고 워크플로가 복잡해짐에 따라 CI/CD 리소스를 효율적으로 활용하는 것이 중요해집니다. 이를 위해 빌드 아티팩트를 재사용하고, 불필요한 재빌드 횟수를 최소화하는 외에도 빌드 대기열 재정렬, 테스트 병렬화 등의 기능을 이용할 수 있습니다.
프로젝트 템플릿
조직의 규모가 클수록 프로젝트 템플릿을 사용하여 더 많은 이점을 얻을 수 있습니다. 일반적인 워크플로를 표준화하면 파이프라인을 생성 및 유지 관리하고, 팀 간의 공동 작업을 개선하며, 잘못된 구성을 방지하고, CI/CD 파이프라인의 보안을 강화하는 데 필요한 노력을 크게 줄일 수 있습니다.
이 사례 연구에서는 수상 경력에 빛나는 게임 개발사인 Gearbox가 TeamCity의 재사용 가능한 프로젝트 템플릿을 사용하여 CI/CD 프로세스를 간소화하고 CI/CD 방식을 표준화할 수 있었던 방법을 소개합니다.
파이프라인이 더욱 복잡해지고 팀 규모가 커짐에 따라 라이선스 또는 구독 가격보다는 CI/CD 시스템의 효율성에 영향을 미칠 수 있는 다른 요소가 더 중요해질 수 있습니다.
통계적으로, 빌드 대기열을 재정렬하고 중복 빌드를 최소화함으로써 팀은 빌드 시간과 관련 비용을 최소 30% 절약할 수 있습니다.
CI/CD가 기본적으로 지원하는 도구와 서비스가 많을수록 사용자 지정 스크립트와 외부 통합을 작성하고 유지 관리해야 할 가능성이 줄어듭니다. 이는 유지 관리 비용에 큰 영향을 미칠 수 있습니다.
또한 대부분의 팀에는 지속적 통합 도구의 오류가 회사 비즈니스에 큰 영향을 미칠 수 있는 피크 기간(일반적으로 릴리스 기간)이 있습니다. 이는 특정 CI/CD 솔루션을 실제 경험해보지 않고는 평가하기 어려운 문제 중 하나입니다. 그래도 유사한 작업을 해본 다른 팀의 리뷰와 피드백을 읽어보면 이러한 문제가 어떻게 처리되는지 이해할 수 있습니다.
궁극적으로, CI/CD 솔루션의 총 소유 비용은 팀의 특정한 필요성과 요구 사항에 따라 달라집니다. 일반적으로 다음 요소를 고려하는 것이 좋습니다.
통합 비용
CI/CD를 버전 관리 시스템, 이슈 트래커, 빌드 및 테스트 프레임워크, 배포 자동화 시스템, 기타 도구와 통합하는 데는 시간과 비용이 매우 많이 소요될 수 있습니다.
유지 관리 비용
모든 CI/CD 솔루션에는 정기적인 보안 감사를 실행하고 기본 인프라를 최신 상태로 유지하며 병목 현상을 진단 및 제거하기 위한 리소스 할당이 필요합니다. 대부분의 회사의 경우, 이러한 프로세스를 지원하려면 온전한 하나의 팀이 필요합니다.
CI/CD 효율성
빌드가 지속적으로 대기열에 놓여 있고 피드백을 신속하게 받지 못한다면 CI/CD 솔루션이 제 역할을 전혀 하지 못하는 것입니다. 클라우드에서 동적으로 확장, 빌드 재사용, 테스트 병렬화와 같은 기능은 큰 규모의 기업에서 개발자 효율성에 큰 영향을 미칩니다.
피드백
효율적이고 생산적인 소프트웨어 개발을 위해서는 시기적절할 뿐만 아니라 실효성 있는 피드백 루프가 필수적으로 확보되어야 합니다. 빌드가 실패하면 개발자는 문제의 근본 원인을 신속하게 확인하고 해결 방법을 명확하게 파악해야 합니다. 빌드 실패에 대해 알림을 받는 시점부터 수정해야 할 사항을 완전히 이해하는 시점까지 무시하지 못할 정도의 지연이 발생합니다. 여기서 신뢰할 수 있는 도구가 큰 가치를 발휘할 수 있습니다.
최고의 CI/CD 도구는 빌드 로그를 분석하고 문제에 대한 정확한 정보를 제공함으로써 개발자가 모든 문제를 빠르고 확실하게 해결하는 데 도움을 주어 더 빠른 피드백 루프와 전반적인 생산성 향상을 가져올 수 있습니다.
TeamCity의 소유 비용을 줄이는 요소:
라이선스 비용
인프라 비용
통합 비용
유지 관리 비용
사용성 및 지원
기능과 사용자 경험 사이에서 최적의 균형을 찾는 일은 CI/CD 솔루션 공급업체가 끊임없이 해결해야 할 과제입니다. 소프트웨어의 사용성을 평가할 때는 다음 요소를 고려해야 합니다.
UI 일관성
프로젝트 규모가 커짐에 따라 CI/CD가 불필요하게 복잡성을 키우지 않으면서 필요한 기능을 제공하는 것이 점점 더 중요해집니다. 솔루션을 평가할 때 가장 중요한 기능이 커뮤니티에서 개발된 것이 아니라 공급업체에서 제공된 것인지 확인하세요.
“경쟁사 제품의 UI는 사용하기가 매우 불편했습니다. 훌륭한 CI/CD 시스템을 접하면 매우 견고하고 어떤 작업도 든든하게 처리해줄 것이라는 믿음이 생기죠. TeamCity의 UI는 매우 잘 다듬어졌어요. 둘러보면 기능도 탁월한 시스템이라는 확신이 들 겁니다.” – Steve Fortier, Gearbox 수석 릴리스 엔지니어
외부 플러그인을 사용할 때는 탐색 문제가 발생하고, 인터페이스가 응답하지 않으며, 용어와 아이콘이 충돌하고, 다양한 화면 크기와 기기에 맞게 제대로 조정되지 않으며, 적절한 문서가 부족한 경우가 많습니다. 팀의 경험이 아무리 많더라도 일관되지 않은 사용자 인터페이스는 언제나 생산성 저하로 이어집니다.
접근성
CI/CD 시스템이 스크린 리더 호환성, 키보드 탐색, 고대비 모드와 같은 접근성 기능을 지원한다면 이는 보통 전반적으로 좋은 사용자 경험을 제공한다는 것을 가리킵니다.
문서 및 지원
CI/CD 도구를 효과적으로 사용하려면 포괄적인 문서, 튜토리얼, 동영상 및 지원 커뮤니티가 필수적일 수 있습니다. 경험상, 솔루션이 시장에 출시된 지 오래될수록 사용자가 문제를 해결하고 질문에 대한 답변을 얻을 가능성이 높아집니다.
API
팀의 특정한 요구 사항과 구현하려는 워크플로에 따라 CI/CD를 외부 도구와 통합해야 할 수도 있습니다. 이때 겪게 되는 경험은 API의 성숙도, 문서 제공 여부와 품질, 소프트웨어 버전 간 변화 속도에 따라 크게 달라질 수 있습니다.
직관적인 사용자 인터페이스는 개발자가 복잡한 프로세스로 작업할 때에도 솔루션을 쉽고 빠르게 이해하고 사용할 수 있도록 도와주기 때문에 CI/CD 솔루션에 필수적입니다.
TeamCity UI 예시
호스팅 모델
CI/CD 솔루션은 크게 클라우드 옵션과 온프레미스 옵션의 두 카테고리로 나눌 수 있습니다.
命令行运行程序的新构建步骤页面将会打开。 您需要提供自定义脚本,用于签署应用捆绑包并将其发布到 Google Play。 在 Custom script(自定义脚本)字段中输入以下代码:
# Create the keystore file from the environment variables
echo %env.ANDROID_KEYSTORE_FILE% > keystore.jks.b64
base64 -d -i keystore.jks.b64 > app/keystore.jks
# Sign the AAB using the keystore and credentials retrieved from the environment variables
jarsigner
-keystore app/keystore.jks
-storepass %env.KEYSTORE_STORE_PASSWORD%
-keypass %env.KEYSTORE_KEY_PASSWORD%
-signedjar release.aab
app/build/outputs/bundle/freeRelease/app-free-release.aab
%env.KEYSTORE_KEY_ALIAS%
# Create the GCP service account credentials file from the environment variables
echo %env.PLAY_CONFIG_JSON% > play_config.json.b64
base64 -d -i play_config.json.b64 > app/play_config.json
# Use GPP to publish the app bundle
./gradlew publishFreeBundle --artifact-dir release.aab
릴리스가 잦은 Android 앱을 출시한 분이라면 잘 정의된 빌드, 테스트, 배포 워크플로가 얼마나 중요한지 이미 알고 계실 겁니다. 복원력이 높은 자동화된 DevOps 워크플로가 없다면 릴리스의 빠른 속도를 유지하기가 어렵습니다. 지속적 통합 및 지속적 배포(CI/CD)를 통해 이런 과정을 자동화한다면 업무를 더 쉽게 처리하고, 버그를 더 빠르게 탐지하여 더 빠르게 릴리스할 수 있습니다.
JetBrains TeamCity는 강력한 파이프라인을 만들어주는 CI/CD 플랫폼입니다. 인기 있는 Android 개발 도구와 원활하게 통합되며, 빌드 및 테스트 단계를 구성할 때 사용자 친화적인 인터페이스를 제공합니다.
이 글에서는 JetBrains TeamCity를 사용하여 Android 프로젝트용 CI/CD 파이프라인을 설정하는 방법을 보여 드립니다. 여러분은 Android CI/CD 파이프라인의 핵심 구성 요소를 살펴보고 TeamCity로 몇 가지 샘플 파이프라인을 구성하는 방법을 자세히 알아보실 수 있습니다.
Android CI/CD 파이프라인의 이해
Android 개발을 위한 효과적인 CI/CD 파이프라인은 표준 DevOps 파이프라인에 있는 모든 단계를 포함하며, 이를 아티팩트 서명 및 Google Play Store 내부 트랙으로의 자동 배포와 같은 추가 프로세스로 강화합니다. 아래는 일반적인 Android CI/CD 파이프라인에 포함되는 모든 단계입니다.
1. 코드 체크아웃 및 버전 관리 통합: 파이프라인은 Git과 같은 버전 관리 시스템(VCS)에서 최신 코드를 가져오는 것에서 시작합니다. TeamCity를 사용 중이라면 인기 버전 관리 도구와의 통합 기능과 코드 커밋 및 병합 시 파이프라인이 자동으로 트리거되는 기능을 활용할 수 있습니다.
2. Gradle로 빌드 자동화: Android 프로젝트에 사용되는 표준 빌드 도구인 Gradle은 이 단계의 핵심입니다. TeamCity는 Gradle 명령어를 실행하여 사용자의 코드를 컴파일링하고, 리소스를 모으고, 빌드 아티팩트를 생성합니다. TeamCity의 빌드 러너는 다양한 Gradle 버전과 호환되며 빌드 구성을 위해 사용자가 설정할 수 있는 환경을 제공합니다.
3. 여러 Android 버전/플랫폼에 대한 유닛 테스트 및 통합 테스트: 다음 단계는 개별 코드 모듈을 검증하는 유닛 테스트 실행과 서로 다른 구성 요소가 어떻게 상호 작용하는지 확인하는 통합 테스트(UI 테스트 포함) 실행입니다. TeamCity에서는 다수의 테스트 러너와 프레임워크(예: JUnit, Espresso)를 구성하고 에뮬레이터나 기기 랩을 활용하여 다양한 Android 버전과 플랫폼을 대상으로 테스트를 실행할 수 있습니다.
4. 정적 코드 분석(JetBrains Qodana 활용) 및 코드 커버리지 보고: 정적 코드 분석으로 잠재적인 버그, 보안 취약점 및 코드 스타일 일관성 문제를 초기에 식별할 수 있습니다. TeamCity는 코드 스멜 탐지, 복잡한 코드 분석 및 다양한 프로그래밍 언어와의 통합을 지원하는 정적 코드 분석 도구인 JetBrains Qodana와 통합되어 있으므로 광범위한 코드 품질 검사를 수행할 수 있습니다. 또한, TeamCity에서는 사용자 코드 중에 어떤 부분이 유닛 테스트로 검사되는지 보여주는 코드 커버리지 보고서도 생성할 수 있습니다. 이 보고서는 개발자가 테스트에 포함되지 않는 부분을 집중해서 살펴볼 수 있도록 도와줍니다.
5. 아티팩트 생성 및 서명(APK 및 AAB): 빌드와 테스트가 성공한 다음의 단계는 배포 가능한 아티팩트를 생성하는 것입니다. Android 앱의 경우 보통 이 단계에서 서명된 Android Package Kit(APK) 또는 Android App Bundle(AAB)을 생성합니다. TeamCity는 빌드 단계를 사용하여 서명 프로세스를 파이프라인 내에서 자동화합니다.
6. 내부 테스트 및 프로덕션 환경으로 배포(Google Play, 베타 채널): CI/CD 파이프라인은 다양한 환경으로 앱을 배포하는 과정을 자동화할 수 있습니다. TeamCity에서는 내부 테스트 플랫폼으로 배포하거나 Google Play의 프로덕션 채널로 바로 배포하도록 구성할 수 있습니다.
7. 지속적인 모니터링과 피드백 루프: 강력한 CI/CD 파이프라인은 배포에서 끝나지 않습니다. TeamCity는 모니터링 도구와도 통합되어 있으므로 앱 성능을 추적하고, 충돌을 식별하고, 사용자의 피드백을 수집할 수 있습니다. 이러한 피드백 루프를 통해 개발자는 문제에 빠르게 대응하고 지속적으로 앱의 품질을 개선할 수 있습니다.
TeamCity로 CI/CD 파이프라인 구축
일반적인 CI/CD 파이프라인 구조를 살펴보았으니 이제 TeamCity로 파이프라인을 구축하는 방법을 알아보겠습니다. 아래의 섹션에서는 TeamCity를 설정하고, 사용자의 Android 프로젝트에 맞는 빌드 구성을 생성하고, 자동화 테스팅과 통합한 다음 마지막으로 앱을 패키지화하고 배포하는 방법을 안내합니다.
간단한 설명을 위해 이번 튜토리얼에서는 14일 무료 평가판으로 제공되는 TeamCity의 클라우드 호스팅 버전을 사용합니다. GitHub, GitLab, Bitbucket 또는 Google 계정을 사용하거나 기존의 방식대로 이메일 주소와 비밀번호를 조합해서 가입할 수 있습니다. 다음 단계로 넘어가기 전에 평가판 또는 구독을 활성화해 주세요.
하지만 이번 튜토리얼에서 TeamCity Cloud를 자체 호스팅 빌드 에이전트나 TeamCity On-Premises와 함께 사용할 수도 있습니다. 자체 호스팅 빌드 에이전트나 TeamCity On-Premises를 사용할 때는 Android SDK를 사용자의 에이전트에 별도로 설치해야 한다는 점에 유의하세요.
TeamCity 설정
TeamCity Cloud 인스턴스에 액세스한 후 초기 화면은 아래와 같습니다.
TeamCity Cloud 대시보드
Android 프로젝트를 시작하려면 페이지 중간에 있는 Create project(프로젝트 만들기)를 클릭하세요. 그러면 프로젝트의 소스 코드가 있는 링크를 입력하라는 요청을 받게 됩니다. Git 호스트 제공자(예: GitHub 또는 Bitbucket Cloud)를 사용하여 가입한 경우 해당 섹션을 확인하여 이에 맞는 프로젝트 생성 과정을 따라 주세요.
저장소 URL을 갖고 있는 경우에는 From a repository URL(저장소 URL로부터) 탭에서 URL을 바로 사용하면 됩니다. TeamCity는 자동으로 Git 호스트 제공자를 탐지하여 프로젝트를 가져옵니다.
프로젝트 만들기 페이지
Android 프로젝트가 없는 경우에는 다음의 저장소를 사용하여 튜토리얼을 진행할 수 있습니다.
액세스하려는 저장소가 비공개이거나 사용자 이름 및 비밀번호 조합으로 보호된 경우 TeamCity가 액세스할 수 있도록 이 단계에서 해당 정보를 입력하세요. 저장소 URL(필요한 경우 상세 정보 포함)을 입력한 후 Proceed(계속하기)를 클릭하세요.
다음 페이지에서는 TeamCity Cloud가 VCS 저장소와의 연결을 검증합니다. 연결에 성공하면 TeamCity가 프로젝트 이름, 디폴트 브랜치 등과 같은 프로젝트와 관련된 일부 메타데이터를 가져옵니다. 이러한 값은 TeamCity 프로젝트에 저장되기 전에 수정할 수 있습니다.
프로젝트 생성 시 연결 검증
이 페이지의 정보가 정확하게 입력되었다면 Proceed(계속하기) 버튼을 클릭하세요. TeamCity가 저장소에서 이용 가능한 구성 파일을 기반으로 저장소에 적용할 수 있는 빌드 단계를 자동으로 탐지합니다. 이 저장소에는 Gradle 기반의 구성 파일이 있기 때문에 사용자가 저장소에서 앱을 빌드할 때 사용할 수 있는 Gradle 작업 모음을 TeamCity가 자동으로 제안합니다(이 경우 clean 및 build).
Gradle 빌드 단계 옆의 확인란을 선택한 다음 Use selected(선택 항목 사용)를 클릭하세요.
자동으로 제안된 빌드 단계 선택
완료되면 작은 배너가 나타나 프로젝트의 첫 빌드를 실행할 수 있다고 알려줍니다. 오른쪽 상단에서 Run(실행)을 클릭하여 첫 빌드를 시작하세요.
첫 빌드 시작
버튼을 클릭하면 빌드가 대기열에 놓이며 빌드 에이전트를 사용할 수 있을 때까지 대기하게 됩니다. 상단 탐색 패널에서 Projects(프로젝트)를 클릭해서 실행 중인 빌드를 선택하면 프로퍼티와 상태를 확인할 수 있습니다.
실행 중인 빌드의 상세 정보
빌드는 약 5~6분 이내에 완료됩니다. 축하합니다! TeamCity에서 첫 Android CI/CD 파이프라인을 설정하셨습니다. 또한, 이 파이프라인을 설정하기 위해 VCS 저장소 URL을 사용하였기 때문에 자동으로 저장소 URL을 일정한 간격마다 확인하여 저장소에 새로운 변경 사항이 푸시되었는지 확인하도록 구성되었습니다. 새로운 변경 사항이 발견되면 파이프라인이 자동으로 최신 커밋을 가져오고 빌드를 다시 실행합니다.
플랫폼에 맞는 웹훅을 설정해서 더욱 개선할 수도 있습니다. 예를 들어 방금 설정한 저장소는 GitHub에 호스팅되어 있습니다. TeamCity에서는 편리하게 GitHub 웹훅을 설치하여 저장소에 특정 활동이 있을 때마다 GitHub가 자동으로 TeamCity에 알림을 보내게 할 수 있습니다.
GitHub 웹훅 설치
원하는 경우 위의 작업을 수행해도 됩니다. 그러나 이번 튜토리얼에서는 필수가 아닙니다.
빌드 아티팩트 구성
설정된 저장소에는 두 가지 옵션이 있습니다(Free 및 Paid). 두 옵션에는 두 가지 빌드 변형이 있습니다(debug 및 release). 이는 build 작업의 결과에 각 버전과 변형의 가능한 조합에 따라 네 가지 바이너리 파일이 포함된다는 의미입니다. 파이프라인 실행이 완료된 후에 이러한 아티팩트를 추출하고 액세스 가능하도록 파이프라인을 구성해 보겠습니다.
이를 위해 상단 탐색 패널에서 Projects(프로젝트)를 클릭하고 Android App Teamcity(Android 앱 Teamcity) 하단의 Build(빌드)를 클릭하여 제목이 Build인 빌드 구성 상세 페이지를 여세요.
빌드 구성 페이지로 이동
여기에서 화면의 오른쪽 상단 모서리에 있는 Edit configuration(구성 편집) 버튼을 클릭하세요.
빌드 구성 편집
여기에서 빌드 구성의 일반적인 설정을 변경할 수 있습니다. 목록의 하단에 Artifact paths(아티팩트 경로)라는 필드가 있습니다. 빌드 실행이 완료된 후에 추출하고 유지하고자 하는 아티팩트의 경로를 이곳에 정의해야 합니다.
아티팩트 경로 설정
Gradle build 작업을 실행할 때 Gradle이 생성하는 아티팩트는 app/build/outputs/apk에 저장됩니다. 따라서 다음을 Artifact paths(아티팩트 경로) 아래에 입력하세요.
app/build/outputs/apk/*/*/* => output
빌드 후에 생성되는 APK 바이너리의 완전한 경로는 app/build/outputs/apk///app---unsigned.apk와 같으므로 app/build/outputs/apk 뒤에 /*/*/*를 추가합니다.
, 및 바이너리 파일 이름의 가능한 값을 모두 반영하기 위해 와일드카드 *를 사용하였습니다.
=> 이는 Ant 스타일 경로의 기능이며 출력 및 입력 디렉터리를 구분할 때 사용됩니다. output은 최종 바이너리가 저장될 폴더의 이름입니다.
이를 추가한 다음 페이지의 하단에서 Save(저장) 버튼을 클릭하세요. 변경 사항이 저장되었다는 노란색 배너가 표시됩니다.
빌드 구성의 변경 사항 저장
이제 페이지의 오른쪽 상단에서 Run(실행) 버튼을 누르고 파이프라인을 다시 실행하여 빌드가 완료된 후 생성된 아티팩트를 볼 수 있습니다.
생성된 아티팩트 확인
저장소의 메인 브랜치에 커밋이 푸시될 때마다 트리거되는 파이프라인이 이제 설정되었습니다. 이 파이프라인은 프로젝트에서 가능한 모든 옵션 및 변형 조합에 대해 서명되지 않은 빌드 아티팩트를 생성하고, 유닛 테스트를 실행하며, 빌드 아티팩트를 읽을 수 있도록 설정합니다.
다음으로는 테스트를 사용자화하는 방법을 알아보겠습니다.
테스트 사용자화
앞서 언급된 것과 같이 build Gradle 작업은 생성된 모든 빌드 아티팩트에 대해 유닛 테스트를 실행합니다. 그러나 앱에 있는 일부 변형에 대해서만 테스트를 실행하고 싶은 상황이 있을 수 있습니다. 이러한 경우에는 clean build 작업을 사용자의 사용 사례에 맞는 적절한 작업으로 대체해야 합니다.
예를 들어 무료 버전 앱의 릴리스 변형에 대해 서명되지 않은 APK를 생성하고 유닛 테스트를 실행하려는 경우 clean build를 assembleFreeRelease testFreeReleaseUnitTest로 대체해야 합니다. 그렇게 하려면 상단 탐색 패널에서 Projects(프로젝트)를 클릭한 다음 Android App Teamcity(Android 앱 Teamcity) 아래의 Build(빌드)를 클릭하세요. 이전 단계와 마찬가지로 다음 페이지의 오른쪽 상단에서 Edit configuration(구성 편집) 버튼을 클릭하세요.
이전에 아티팩트 경로를 구성할 때 액세스했던 빌드 구성의 General Settings(일반 설정) 페이지로 이동합니다. 왼쪽 탐색 패널에서 Build Step: Gradle(빌드 단계: Gradle)을 클릭하세요.
빌드 설정으로 이동
그러면 Build Steps(빌드 단계) 페이지가 열리며, 여기서 이 빌드 구성의 빌드 단계를 수정할 수 있습니다. 첫 빌드 단계(제목: Gradle)의 오른쪽에 있는 Edit(편집)을 클릭하세요.
Gradle 빌드 단계 편집
이제 Gradle tasks(Gradle 작업) 필드를 업데이트하여 이 빌드의 일환으로 실행될 작업을 변경할 수 있습니다. clean build를 assembleFreeRelease testFreeReleaseUnitTest로 바꾸세요.
Gradle 작업 업데이트
이제 하단에서 Save(저장)를 누르세요. 변경 사항이 저장되면 오른쪽 상단에서 Run(실행) 버튼을 클릭하세요. 이 빌드 구성이 추가로 실행됩니다.
빌드 실행이 완료되면 빌드 실행 상세 정보 페이지의 Tests(테스트) 탭에서 TeamCity가 생성한 보고서를 볼 수 있습니다.
테스트 결과 확인
유닛 테스트마다 실행하는 데 걸린 시간과 테스트 완료 후 남은 스택 추적을 확인할 수 있습니다. 또한, 테스트의 오른쪽 끝에 있는 점 세 개를 클릭한 다음 Show test history(테스트 기록 표시)를 선택하면 현재의 테스트 실행과 이전 실행의 성능 차이를 비교할 수 있습니다.
테스트 실행 기록 비교
테스트 조사를 팀원에게 할당하고 조사 기록을 TeamCity 내에서 추적할 수 있습니다. 원하는 경우 테스트 개요 페이지에서 Download(다운로드) 링크를 클릭하여 테스트 결과를 다운로드할 수도 있습니다.
이 저장소는 테스트 개수가 적기 때문에 빌드 실행이 수 분 만에 완료되었습니다. 그러나 실제 프로젝트에서는 수천 개까지는 아니더라도 수백 개의 유닛 테스트가 있습니다. 그러한 상황에서 동일한 러너 에이전트로 모든 테스트를 순차적으로 실행하면 많은 시간이 소요됩니다. 이 문제는 TeamCity의 병렬 테스트 빌드 기능을 사용하면 해결됩니다.
TeamCity는 테스트 실행을 나누어 다수의 빌드 에이전트에 할당하여 병렬화할 수 있기 때문에 테스트를 모두 실행하는 데 걸리는 시간을 최소화할 수 있습니다. 이를 설정하기 위해 빌드 실행 상세 정보 페이지에서 Edit configuration(구성 편집) 버튼을 클릭한 다음 왼쪽 탐색 패널에서 Build Features(빌드 기능)를 클릭하세요.
빌드 기능 페이지로 이동
Build Features 페이지에서 + Add build feature(빌드 기능 추가) 버튼을 클릭하세요. 대화상자가 열리면 드롭다운 메뉴에서 Parallel tests(병렬 테스트)를 선택하세요.
병렬 테스트 검색
병렬로 테스트를 실행할 때 사용할 최대 배치 개수를 입력해야 합니다. 병렬화의 이점을 최대한 활용하려면 4에서 8 사이의 값을 입력하세요.
병렬 빌드 배치 설정
완료한 후 Save(저장) 버튼을 클릭하세요. 이제 테스트 사례가 풍부한 저장소의 테스트를 실행하여 성능 차이를 직접 확인해 볼 수 있습니다!
다수의 빌드 관리
앱에 여러 설정과 변형이 있기 때문에 TeamCity의 매트릭스 빌드를 활용하여 각 설정 및 변형 조합을 별도의 실행 인스턴스로 나눠서 빌드 파이프라인의 속도를 높이는 게 좋습니다. 또한, 모든 조합을 빌드하거나 하나의 조합만 빌드하는 것이 아닌, 애플리케이션의 특정 조합을 빌드할 수도 있습니다.
이를 위해서는 새로운 빌드 구성을 생성해야 합니다. 상단 탐색 패널에서 Projects(프로젝트)를 클릭한 다음 Android App Teamcity(Android 앱 Teamcity)를 클릭하세요. 프로젝트 상세 정보 페이지의 오른쪽 상단 모서리에서 Edit project…(프로젝트 편집…)를 클릭하세요.
프로젝트 구성으로 이동
General Settings(일반 설정) 페이지의 Build Configurations(빌드 구성) 섹션에서 + Create build configuration(빌드 구성 만들기) 버튼을 클릭하세요.
새 빌드 구성 만들기
그러면 Create Build Configuration 마법사가 열립니다. Repository URL(저장소 URL) 필드에 이전과 같은 저장소 URL(https://github.com/krharsh17/android-app-teamcity)을 입력하고 Proceed(계속하기)를 클릭하세요.
저장소 URL 입력
Matrix Builds(매트릭스 빌드) 옆의 페이지에서 Build configuration name(빌드 구성 이름)을 설정하고 다른 필드는 모두 디폴트 값으로 두세요. 그런 다음 Proceed(계속하기) 버튼을 클릭하세요.
빌드 구성 상세 정보 설정
유사한 VCS 루트가 발견되었다고 TeamCity가 알려줍니다. 대화상자에서 Use this(이 항목 사용) 버튼을 클릭하세요.
기존의 VCS 루트 선택
이러면 TeamCity가 두 빌드 구성에 대해 VCS URL을 한 번만 폴링하기 때문에 추가적인 성능 오버헤드를 피할 수 있습니다.
빌드 구성이 완료되면 빌드 구성이 생성되었다는 알림을 받게 됩니다.
새 빌드 생성 완료
이번에는 clean build Gradle 작업을 설정할 필요가 없으므로 이 페이지에서는 어떤 확인란도 선택하지 마세요. 대신 테이블 위에 있는 configure build steps manually(수동으로 빌드 단계 구성) 링크를 클릭하세요.
그러면 New Build Step(새 빌드 단계) 페이지로 이동되며 이곳에서 빌드 단계에 사용할 선호하는 러너를 선택할 수 있습니다.
이렇게 하면 러너가 먼저 빌드 폴더를 비운 다음 환경 변수에 입력된 설정과 변형에 대해 테스트 작업을 실행합니다. 예를 들어 무료 앱의 릴리스 변형의 경우 작업의 이름이 clean testFreeRelease로 지정됩니다.
아래로 스크롤한 다음 Save(저장) 버튼을 클릭하세요. 그러면 Build Steps(빌드 단계) 페이지로 이동됩니다.
새로운 빌드 단계 추가
+ Add build step(빌드 단계 추가) 버튼을 클릭한 다음 assemble%env.FLAVOR%%env.VARIANT% 작업을 포함한 Gradle 빌드 단계를 추가하세요. 이 단계는 앱의 옵션 및 변형에 따라 빌드 아티팩트를 생성합니다.
완료한 후 Build Steps(빌드 단계) 페이지에는 생성한 두 개의 Gradle 기반 빌드 단계와 더불어 빌드 단계의 일부로 실행되는 Gradle 작업의 빠른 요약이 목록으로 표시됩니다.
업데이트된 빌드 단계
이제는 사용한 두 환경 변수의 값을 정의하고 아티팩트 경로를 구성하는 등 두 가지 절차를 더 수행해야 합니다.
빌드 구성의 아티팩트 경로를 설정하는 방법은 이미 알고 계실겁니다. 이 빌드 구성에서는 Artifact paths(아티팩트 경로) 필드의 값을 이전과 마찬가지로 app/build/outputs/apk/*/*/* => output으로 설정하세요.
옵션 및 변형 필드의 매트릭스 값을 설정하려면 왼쪽 탐색 패널에서 Build Features(빌드 기능)를 클릭하세요. Build Features 페이지에서 + Add build feature(빌드 기능 추가) 버튼을 클릭한 다음 대화상자의 드롭다운 메뉴에서 Matrix Build(매트릭스 빌드)를 검색하세요.
Build Features 페이지에서 Matrix Build 검색
드롭다운 목록에서 Matrix Build 옵션을 선택하면 매트릭스 빌드의 매개변수와 값을 입력하도록 요청받게 됩니다. 매개변수의 이름에는 env.FLAVOR를, 값에는 Free를 입력합니다. env.VARIANT라는 다른 매개변수를 추가하고 두 개의 값으로 Release 및 Debug를 추가합니다.
매트릭스 빌드 구성
이제 Save(저장) 버튼을 클릭하세요. 이로써 파이프라인에 매트릭스 빌드가 설정되었습니다. 페이지의 오른쪽 상단 모서리에서 Run(실행) 버튼을 클릭하여 테스트해 볼 수 있습니다.
이제 각 실행의 결과를 별도의 빌드 아티팩트 및 테스트 결과와 함께 볼 수 있습니다.
매트릭스 빌드 결과
Dependencies(종속성) 탭을 클릭하여 각 실행의 빌드 실행 상세 정보를 확인할 수 있습니다.
각 빌드 실행의 상세 정보 확인
이전에 보았던 것처럼 각 항목을 독립적이며 완전한 빌드 실행으로 간주하고 탐색할 수 있습니다.
패키지 제작 및 배포
Android CI/CD 파이프라인에서 중요한 요소 중 하나는 릴리스 바이너리가 사용자에게 게시될 수 있도록 Google Play로 푸시하는 것입니다. TeamCity와 Gradle Play Publisher(GPP)를 사용하여 이 과정도 자동화할 수 있습니다.
이 프로세스를 시작하기 전에 몇 가지 전제 조건이 있습니다.
1. Android 프로젝트의 첫 번째 APK/AAB를 Google Play Console로 수동으로 업로드했는지 확인하세요.
3. Google Cloud Platform 서비스 계정을 생성해야 Google Play 개발자 API를 사용하여 JSON 자격 증명 파일을 받아올 수 있습니다. 이를 위해 다음 단계로 넘어가기 전에 이 단계를 따라주세요.
위의 링크에 설명된 단계를 완료한 후 Android 프로젝트에 GPP를 설치하고 구성해야 합니다. 이를 위해 앱 수준의 build.gradle.kts 파일에 있는 플러그인 블록에 다음의 코드를 추가하세요.
kt
id("com.github.triplet.play") version "3.9.1"
그런 다음 이 파일의 루트 수준에 다음의 콘텐츠를 포함한 play {} 블록을 새로 추가하세요.
kt
play {
    serviceAccountCredentials.set(file("play_config.json"))
    track.set("internal")
    releaseStatus.set(ReleaseStatus.DRAFT)
    defaultToAppBundles.set(true)
}
이는 GPP를 구성하여 이름이 play_config.json인 파일의 서비스 계정 자격 증명을 사용하고, 트랙을 internal로 설정하고 바이너리를 Play Console로 푸시할 때 상태를 DRAFT로 릴리스하며, 기본적으로 APK 대신에 앱 번들을 사용합니다.
이로써 Android 프로젝트에 필요한 구성 과정이 완료되었습니다. 진행하기 전에 이러한 변경 사항을 GitHub 저장소로 커밋하고 푸시하세요.
이제 TeamCity에서 Google Play로 바이너리를 푸시하기 위해 새로운 빌드 구성을 생성해야 합니다. 새로운 빌드 구성을 생성하기 전에 같은 단계를 수행해 주세요. Gradle을 러너로 사용하고 bundleFreeRelease를 실행할 Gradle 작업으로 사용하도록 첫 번째 빌드 단계를 설정하세요.
빌드 단계
이 빌드 구성에 단계를 하나 추가하여, 이번에는 빌드 러너로 Command Line(명령줄)을 선택하세요.
명령줄 빌드 단계 구성
명령줄 러너를 위한 새로운 빌드 단계 페이지가 열립니다. 앱 번들을 서명하고 Google Play로 게시하는 맞춤형 스크립트를 입력해야 합니다. Custom script(맞춤형 스크립트) 필드에 다음의 코드를 입력하세요.
# Create the keystore file from the environment variables
echo %env.ANDROID_KEYSTORE_FILE% > keystore.jks.b64
base64 -d -i keystore.jks.b64 > app/keystore.jks

# Sign the AAB using the keystore and credentials retrieved from the environment variables
jarsigner
-keystore app/keystore.jks
-storepass %env.KEYSTORE_STORE_PASSWORD%
-keypass %env.KEYSTORE_KEY_PASSWORD%
-signedjar release.aab
app/build/outputs/bundle/freeRelease/app-free-release.aab
%env.KEYSTORE_KEY_ALIAS%

# Create the GCP service account credentials file from the environment variables
echo %env.PLAY_CONFIG_JSON% > play_config.json.b64
base64 -d -i play_config.json.b64 > app/play_config.json

# Use GPP to publish the app bundle
./gradlew publishFreeBundle --artifact-dir release.aab
해당 코드에는 각 줄을 설명하는 인라인 주석이 포함되어 있습니다. 완료한 후에 페이지의 하단에서 Save(저장) 버튼을 클릭하세요.
명령줄 스크립트 구성
또한, 다음의 환경 변수를 정의하여 앱을 서명하고 게시할 때 사용할 적절한 자격 증명을 스크립트에 입력해야 합니다.
왼쪽 탐색 패널에서 Parameters(매개변수)를 클릭하여 환경 변수를 정의할 수 있는 페이지로 이동하세요. TeamCity가 이미 이 페이지의 필수 변수 목록을 채워놓은 것을 확인할 수 있습니다.
새로 인식된 환경 변수 표시
KEYSTORE_KEY_ALIAS, KEYSTORE_KEY_PASSWORD 및 KEYSTORE_STORE_PASSWORD의 경우 Edit(편집)을 클릭하고 표시되는 대화상자에서 값을 입력하세요.
환경 변수 구성
ANDROID_KEYSTORE_FILE과 PLAY_CONFIG_JSON의 경우 먼저 파일을 openssl과 같은 도구를 사용하여 Base64로 변환해야 하며, Base64로 인코딩된 내용을 각 변수의 값 필드에 붙여넣으세요.
이를 통해 사용자의 애플리케이션 중 무료 버전의 서명된 릴리스를 빌드하고 게시하도록 파이프라인이 설정됩니다. 페이지의 오른쪽 상단에 있는 Run(실행) 버튼을 클릭해서 실행하면 실제로 동작하는 것을 확인할 수 있습니다.
성공적으로 실행되면 로그에서 BUILD SUCCESSFUL 메시지를 확인할 수 있습니다.
성공한 빌드의 결과 로그
앱의 최신 릴리스를 Google Play Console의 내부 트랙에서 볼 수 있으며, 사용자가 편집 및 홍보할 수 있습니다.
Play Console 내부 테스트 페이지
새로운 릴리스도 이전 릴리스와 같은 개발자용 이름(“2.0”)을 사용하는 것을 확인할 수 있습니다. 이는 GPP의 구성에 이름이 지정되지 않았기 때문입니다. 이름을 사용자가 지정하는 방법을 알아보려면 GPP 문서를 참조하세요.
모범 사례와 팁
이제 TeamCity을 사용하여 나만의 Android 파이프라인을 설정할 수 있게 되었으니 파이프라인의 효율성과 속도를 높이기 위해 고려할 만한 주요 모범 사례를 소개해 드리겠습니다.
1. 버전 관리 및 버전 관리 모범 사례: 효율적인 CI/CD 파이프라인에는 Git과 같은 강력한 버전 관리 시스템(VCS)이 필요합니다. 팀이 명확한 버전 관리 모범 사례를 따르고 일관적인 브랜치 전략(예: 피처 브랜치)을 구현하는지 확인하세요. 예를 들어 WIP 코드에 불필요한 단계가 실행되지 않도록 하기 위해 각 브랜치마다 맞춤형 파이프라인을 개발하세요.
2. 명확한 통과/실패 기준 및 임곗값: 빌드 및 테스트 실행 성공 기준을 명확하게 정의하세요. 여기에는 유닛 테스트 커버리지의 임곗값을 설정하거나 다른 코드 검사에서 그린 라이트를 받도록 하는 등의 조치가 포함됩니다. 파이프라인의 각 단계에 통과/실패 기준을 적용하도록 TeamCity을 구성하여 안정적인 빌드를 만들고 개발자들이 더 나은 품질의 코드를 작성하도록 장려하세요.
3. TeamCity의 알림 및 경고 활용: TeamCity에는 웹 브라우저, 이메일, Slack 및 IDE에서 발생하는 파이프라인 이벤트에 관해서 사용자에게 알려주는 상세한 알림 시스템이 있습니다. 빌드 실패와 중요한 테스트 실패에 대한 경고를 설정하여 개발 팀이 항상 상황을 인식하고 빠르게 문제를 해결할 수 있도록 하세요.
4. 공동 작업 및 피드백 루프: 효율적인 CI/CD 파이프라인은 개발 팀 내의 공동 작업을 강화합니다. 개발자들이 전체 빌드 및 테스트 프로세스를 명확하게 이해할 수 있도록 TeamCity 내의 파이프라인 시각화 기능을 사용하세요. 또한, 테스트 및 빌드 조사를 사용하여 TeamCity 내에서 바로 빌드 또는 테스트의 실패 원인에 대한 조사를 할당하고 협업할 수 있습니다. 그리고 팀원이 빌드 실패와 코드 커버리지 보고서를 검토하여 개선 영역을 파악하도록 장려하세요. 이를 통해 코드 품질 추구하고 지속적으로 개선하는 문화를 만들 수 있습니다.
5. 보안 조치(코드 서명 및 액세스 제어): TeamCity 인스턴스를 구성할 때 적절하게 액세스를 제어하여 서명 키와 같은 민감한 정보에 대한 액세스는 해당 정보에 액세스해야 하는 사용자만 가능하도록 제한하세요. HashiCorp Vault와 같은 도구를 사용하여 빌드에 사용할 수 있는 모든 중요한 자격 증명을 관리하고 로테이션을 실시하는 것도 고려해야 합니다. TeamCity의 주요 보안 추천 사항은 여기에서 확인할 수 있습니다.
결론
이 글에서 여러분은 JetBrains TeamCity를 사용하는 Android 개발 프로젝트에서 상세한 CI/CD 파이프라인을 만들고 관리하는 방법을 알아보았습니다. 코드 체크아웃과 버전 관리 통합에서부터 서명, 배포 및 모니터링에 이르는 Android CI/CD 파이프라인의 주요 단계를 살펴보았습니다. 또한 TeamCity가 각 단계를 지원하고 개발 워크플로를 간소화하는 방법을 알아보았습니다. 마지막에는 파이프라인 운영 효율성을 보장하는 주요 모범 사례도 배웠습니다.
TeamCity로 Android 파이프라인을 설정하면 워크플로의 효율성을 크게 높일 수 있습니다. 이를 통해 릴리스 주기를 단축하고, 버그는 줄이고, 궁극적으로 고품질의 Android 앱을 더 효율적으로 배포할 수 있습니다. 지금 개발 프로세스를 더 간소화하기 위한 첫 걸음을 내딛고 CI/CD 파이프라인을 직접 만들어 보세요!
This post was created in collaboration with a TeamCity .NET developer Nikolay Pianikov.
Microsoft has recently released .NET 5, a new SDK that unifies all the modern .NET tools. In anticipation of this, we have revised our integration with .NET in a new build runner that has been available since TeamCity 2019.2.3.
In this blog series, we’ll tell you about this new integration and take you through a demo project you can run on your server.
Old approach vs. new approach
If you’ve worked with .NET in TeamCity before, you’ll already know that the variety of integration tools it provides can be pretty overwhelming. As Microsoft strives to combine all .NET functionality together into one SDK, we have also decided to streamline our approach to building .NET projects.
Previously, TeamCity offered the following .NET components:
Most of the listed runners are now represented by a single .NET runner. This makes it much easier to compose your build projects and test them on multiple OSs using one transparent solution. The new runner supports:
We are still supporting the obsolete runners to give our users enough time to migrate. But, this support is limited and we are not going to be adding any new features to these runners. If you have not migrated yet, check out the .NET runner documentation for instructions. If you have any trouble migrating, please leave a comment or let us know about it via one of our feedback channels.
Demo project
To illustrate the new approach, we’ve created a demo project. In Part 1, we will describe its structure. For more details and helpful tips, keep an eye out for the next parts of this blog series. If you’d like to follow along, you can clone the demo repository and run this project yourself.
To configure CI/CD for this source project, we’ve designed a hierarchy of projects and build configurations in TeamCity.
Though TeamCity has a friendly UI, we prefer to keep all configurations in Kotlin DSL. This way, it is easy to version project settings and reuse them. For example, you can just fork our demo source code and Create a project from its URL on your TeamCity server. There is no need to set up anything manually.
If you are curious about how to create configurations as a code, we recommend reading this blog series.
The root demo project in TeamCity comprises two build configurations and two subprojects.
The “Build” configuration aggregates apps and packages from configurations of the “Building” subproject:
The “Deploy” configuration, predictably, deploys them into Docker and NuGet repositories:
This way, we build a hierarchy of configurations, each of which serves its granular purpose: one for testing on Linux, one for building an Android app, and so on.
All these configurations use system parameters that are passed to .NET commands as key-value pairs: /p:key=value. For example, if a build configuration has the system.configuration=Release system parameter, each launched .NET command will be run with the /p:configuration=Release parameter. The prefix system. will be omitted as it is only needed to indicate the parameter type in TeamCity.
Here’s the list of all parameters used in the build configurations:
You can include these parameters directly in project files or pass them via command-line parameters. By using system parameters, you don’t have to worry about the nuances of passing special characters as TeamCity will take care of all of it.
To run these configurations, we used the following build agents:
Windows 10 x64 Pro 10.0.19041
Visual Studio 2019 Pro 16.7.5
Docker (Windows container) 19.03.13
.NET SDK 5.0
Ubuntu 16.04
Docker 18.06.3
This was just the general structure of our demo project. In the next part of this series, we will talk about its build and test configurations in more detail. Meanwhile, you can explore this project yourself or read the .NET runner documentation.
Once again, your feedback is very important to us. Please let us know if you like the new .NET runner and what you expect from it in the future.
In this blog series, we talk about the new approach we use to integrate TeamCity with .NET. Part 1 describes the .NET runner, that covers most of the core integration functionality, and introduces a demo project. In Part 2, we will dig deeper into the demo project and explore its Test and Build configurations.
To run all build configurations, we use the following agents:
(A) Windows 10 x64 Pro 10.0.19041
Visual Studio 2019 Pro 16.7.5
Docker (Windows container) 19.03.13
.NET SDK 5.0
(B) Ubuntu 16.04
Docker 18.06.3
Cross-platform testing
As described in Part 1, the demo project contains two build configurations that provide cross-platform testing of our app.
These build configs, "Test on Windows" and "Test on Linux", test the app’s basic logic and collect code coverage statistics on Windows (agent A) and in a Linux Docker container .NET SDK (agent B), using a single .NET step. For example, in a Linux configuration, this step looks like this:
For Linux, the app’s libraries are tested inside the .NET SDK 5.0 container. In the Windows configuration, the step looks similar but doesn’t use Docker.
Our source subproject Clock.Tests is a .NET 5.0 application, so we can simply use the test command to run the tests. To collect and analyze code coverage statistics, we’ve selected JetBrains dotCover. It is automatically installed from the JetBrains.dotCover.DotNetCliTool package as an agent tool.
In the DSL, you can find both Linux and Windows test configurations under a common parent, TestBase.
Building console and web apps
As is clear from their names, the "Build console and web for win-x64" and "Build console and web for linux-x64" configurations are responsible for building two versions of the app from two source subprojects: Clock.Console and Clock.Web. Each configuration comprises two steps, one for each version of the app.
Clock.Console and Clock.Web are .NET 5.0 applications as well, so we can build and publish them using a single .NET Core CLI command – publish. Here is the example first step on Linux:
It builds and publishes the console Clock app into a single executable under the bin/Clock.Console/linux-x64 directory.
On Windows, this step has different values for the Runtime (win-x64) and Output directory fields (bin/Clock.Console/win-x64).
The second step builds and publishes the web version of the app. It uses a different project path and output directory.
After completing the two steps of each configuration, TeamCity publishes two resulting apps as build artifacts under the specified output directory.
In the DSL, these configs are inherited from the BuildConsoleAndWebBase class, which is inherited from BuildBase – the base class for all building configurations. We could have merged the two steps into one by declaring both subprojects in projects, but that would make it difficult to set apart binary files for the two apps. Now it is easily done with the help of the outputDir property.
Building Windows app
Our project can also build a desktop version of the app for Windows. The "Build Windows desktop" configuration has only one step:
It runs MSBuild from Visual Studio 2019, which is installed on agent A, and consequently executes the required targets for two subprojects:
Clock.Desktop/Clock.Desktop.csproj
Clock.Desktop.Uwp/Clock.Desktop.csproj
The results are published into two different directories that are specified in the system parameters: PublishDir (for Clock.Desktop) and AppxPackageDir (for Clock.Desktop.Uwp). These directories then appear in the build results as the build artifacts.
Building Android app
The "Build Android App" configuration builds the Clock app for the Android platform. Like the Windows configuration, it uses MSBuild from Visual Studio 2019 installed on agent A:
This config has only one step, and it is similar to the one on Windows. However, we use SignAndroidPackage instead of the Publish target because we need to publish a signed Android package.
That concludes the second part of our series. As you can see, building projects with our .NET runner is now more transparent than ever.
In the final part of this series, we will show how we pack, aggregate, and deploy our multi-platform app.
Your feedback is very important to us. If you’ve tried the new runner, please let us know about your experience and expectations.
TeamCity REST API is a powerful tool which lets you integrate external applications with the TeamCity server and create diverse script interactions. To make this instrument more useful and easier to understand, we have reworked the REST API documentation.
Compared to a general guide we had in the past, the new documentation provides more details and offers better navigation between sections. For beginners, it offers a quick start guide and describes common use cases. We plan to describe more popular cases and explore advanced topics in the future.
Experienced users will appreciate the full reference on API models, methods, and locators. It is automatically generated based on the source code of the most recent REST API version.
As this documentation is a work in progress, we will be glad to receive your feedback. Leave a comment to this post or use the "Was this page helpful?" widget at the bottom of each documentation page.
For now, we kept the previous REST API guide as is. If you find it more convenient, you can continue using it, though we encourage you to try the new docs.
We hope you enjoy using the new REST API documentation!