Quantcast
Channel: How-To’s : TeamCity | The JetBrains Blog
Viewing all 103 articles
Browse latest View live

Kotlin Configuration Scripts: Extending the TeamCity DSL

$
0
0

This is part four of the five-part series on working with Kotlin to create Configuration Scripts for TeamCity.

  1. An Introduction to Configuration Scripts
  2. Working with Configuration Scripts
  3. Creating Configuration Scripts dynamically
  4. Extending the TeamCity DSL
  5. Testing Configuration Scripts

TeamCity allows us to create build configurations that are dependent on each other, with the dependency being either snapshots or artifacts. The configuration for defining dependencies is done at the build configuration level. For instance, assuming that we have a build type Publish that has a snapshot dependency on Prepare Artifacts, we would define this in the build type Publish in the following way

class Publish : BuildType({
    uuid = "53f3d94a-20c6-43a2-b056-baa19e55fd40"
    extId = "Test"
    name = "Build"
    vcs {
        . . .
    }
    steps {
        . . . 
    }
    dependencies {
        dependency(Prepare_Artifacts) {
            snapshot {
                onDependencyFailure = FailureAction.FAIL_TO_START
            }
        }
    }
})

and in turn if Prepare Artifacts had dependencies on previous build configurations, we’d define these in the dependencies segment of its build configuration.

TeamCity then allows us to visually see this using the Build Chains tab in the user interface

Build Chains

Defining the pipeline in code

Pipeline is a sequence of phases, phase is a set of buildTypes, each buildType in a phase depends on all buildTypes from the previous phase. This can handle simple but common kind of build chains where some build produces an artifact, several builds test it in parallel and the final build deploys the result if all its dependencies are successful.

It would often be beneficial to be able to define this build chain (or build pipeline) in code, so that we could describe what’s going on from a single location. In essence, it would be nice to be able to define the above using the Kotlin DSL as so

object Project : Project ({
   . . . 
   pipeline {
        phase("Compile all clients") {
            + HttpClient
            + FluentHc
            + HttpClientCache
            + HttpMime
        }
        phase("Prepare artifacts") {
            + PrepareArtifacts
        }
        phase("Deploy and publish to CDN") {
            + Publish
        }
   }
})

Defining this at the Project.kt level in our DSL, would give us a good oversight of what’s taking place.

The issue is though that currently the TeamCity DSL does not provide this functionality. But that’s where Kotlin’s extensibility proves quite valuable as we’ll see.

Creating our own Pipeline definition

Kotlin allows us to create extension functions and properties, which are a means to extend a specific type with new functionality, without having to inherit from these. When passing extension functions as arguments to other functions (i.e. higher-order functions), we get what we call in Kotlin Lambdas with Receivers, something we saw in this series already when Generalising feature wrappers in the second part of this series. We apply the same concept here to create our pipeline DSL

class Pipeline {
    val phases = arrayListOf<Phase>()

    fun phase(description: String = "", init: Phase.() -> Unit = {}) {
        val newPhase = Phase()
        newPhase.init()
        phases.lastOrNull()?.let { prevPhase ->
            newPhase.buildTypes.forEach {
                it.dependencies {
                    for (dependency in prevPhase.buildTypes) {
                        snapshot(dependency)
                    }
                }
            }
        }
        phases.add(newPhase)
    }
}

class Phase {
    val buildTypes = hashSetOf<BuildType>()

    operator fun BuildType.unaryPlus() {
        buildTypes.add(this)
    }
}

fun Project.pipeline(init: Pipeline.() -> Unit = {}) {
    val pipeline = Pipeline()
    pipeline.init()
    //register all builds in pipeline
    pipeline.phases.forEach { phase ->
        phase.buildTypes.forEach { bt ->
            this.buildType(bt)
        }
    }
}

What the code above is doing is define a series of new constructs, namely pipeline and phase.

The code then takes the contents of what’s passed into each of these and defines, under the covers, the dependencies. In essence, it’s doing the same thing we would do in each of the different build configurations, but from a global perspective defined at the Project level.

In order to pass in the configuration to the pipeline as we saw earlier, we merely reference the specific build type (HttpClient, Publish, etc.), assigning it to a variable

val HttpClient = BuildType(....)

Flexibility of defining our own pipeline constructs

It’s important to understand that this is just one of many ways in which we can define pipelines. We’ve used the terms pipeline and phase. We could just as well have used the term stage to refer to each phase, or buildchain to refer to the pipeline itself (and thus align it with the UI). In addition to how we’ve named the constructs, and more importantly, is how the definition is actually constructed. In our case, we were interested in having this present in the Project itself. But we could just as well define a different syntax that is used at the build type level. The ability to easily extend the TeamCity DSL with our own constructs, provides us with this flexibility.


TeamCity as Debian Package Repository

$
0
0

Recently we’ve been experimenting around using TeamCity as a Debian repository and we’d like to share some tips and tricks we’ve come up with in the process.

We used the TeamCity tcDebRepository plugin to build *.deb packages and serve package updates to Debian/Ubuntu servers. The plugin, the special prize winner of the 2016 TeamCity plugin contest, works like a charm, but we’ve encountered a few difficulties with the software used to build and package .deb files, hence this blog post.

It’s important to note that tcDebRepository is not capable of serving packages to recent Ubuntu versions due to the lack of package signing. This is planned to be resolved in version 1.1 of the plugin (the plugin compatibility details).

We do not intend to cover the basics of TeamCity and Debian GNU/Linux infrastructure. To get acquainted with TeamCity, this video might be helpful. Building Debian packages is concisely described in the Debian New Maintainers’ Guide.

Everything below applies to any other Debian GNU/Linux distribution, e.g. Astra Linux.

Prerequisites and Project Setup

We arbitrarily chose 4 packages to experiment with:

Our setup uses:

  1. The free Professional version of TeamCity 10 with 3 agents managed by Debian 8.0 (Jessie).
  2. The tcDebRepository plugin installed as usual.
  3. Besides the Teamcity agent software, each of the agents required installing:
    • the build-essential package as a common prerequisite
    • the dependencies (from the 01-build-depends build-depends and 02-build-depends-indep build-depends-indep categories) required for individual packages.

Next we created a project in TeamCity with four build configurations (one per package):
teamcity-build-configs

Configuring VCS Roots

When configuring VCS Roots in TeamCity, types of Debian GNU/Linux packages had to be taken into account.

Debian packages can be native and non-native (details).
The code of native packages (e.g. debhelper, dpkg), developed within the Debian project, contains all the meta-information required for building (the debian/ directory in the source code tree).
The source code of non-native packages (e.g. bash) is not related to Debian, and an additional tree of their source code and meta-information with patches (contained in the debian/ directory) has to be maintained.

Therefore, for native packages we configured one VCS Root (pointing to Debian); whereas non-native packages needed two roots.

Next we configured checkout rules: the difference from the usual workflow is that in our case the artifacts (Debian packages) will be built outside the source code, one directory higher. This means that the checkout rules in TeamCity should be configured so that the source code of the dpkg package is checked out not into the current working directory, but into a subdirectory with the same name as the package, i.e. pkgname/. This is done by adding the following line to the checkout rules:
+:.=>pkgname
Finally, a VCS trigger was added to to every configuration.

Artifact paths

In terms of TeamCity, the binary packages we are about to build are artifacts, specified using artifact paths in the General Settings of every build configuration:

03-teamcity-debian-general-artifact-paths

For native packages, the pkgname.orig.tar.{gz,bz2,xz,lzma} and pkgname.debian.tar.{gz,bz2,xz,lzma} will not be created.

Build Step 1: Integration with Bazaar

Building a package with Bazaar-hosted source code (bash in our case) requires integration with the Bazaar Version Control System not supported by TeamCity out-of-the box. There is an a 3rd party TeamCity plugin to support Bazaar, but it has at least two problems:

  1. agent-side checkout is not supported
  2. the plugin is based on bzr xmlls and bzr xmllog (the bzr commands invoked by the plugin), but these commands are provided by external modules not necessarily available in the default Bazaar installation

The TeamCity server we used is running Windows, so we decided not to opt for installing Bazaar on the server side. Instead, to build the bash package, we added a build step using the Command Line Runner and a shell script for Bazaar integration:

#!/bin/bash

export LANG=C
export LC_ALL=C

set -e

rm -rf bash/debian
bzr branch http://bazaar.launchpad.net/~doko/+junk/pkg-bash-debian bash/debian
major_minor=$(head -n1 bash/debian/changelog | awk '{print $2}' | tr -d '[()]' | cut -d- -f1)
echo "Package version from debian/changelog: ${major_minor}"
tar_archive=bash_${major_minor}.orig.tar
rm -f ${tar_archive} ${tar_archive}.bz2
# +:.=>bash checkout rule should be set for the main VCS root in TeamCity
tar cf ${tar_archive} bash
tar --delete -f ${tar_archive} bash/debian
# Required by dpkg-buildpackage
bzip2 -9 ${tar_archive}

This approach will not allow us to see the changes in one of the two trees of the source codes and run build automatically on changes, but it is ok as the first try.

Build Step 2. Initial configuration

We used the Command Line Runner to invoke dpkg-buildpackage. The -uc and -us keys in the image below indicate that digital signatures are currently out of scope for our packages. If you wish to sign the packages, you’ll have to load the corresponding pair of GnuPG keys on each of the agents.

Note that the “Working directory” is not set to the current working directory, but to the subdirectory with the same name as the package (bash in this case) where the source code tree will be checked out and dpkg-buildpackage will be executed. If the VCS Root is configured, the “Working directory” field can be filled out using the TeamCity directory picker, without entering the directory name manually:

07-teamcity-debian-dpkg-buildpackage-step

After the first build was run, we encountered some problems.

Build problems resolution

Code quality

For some packages (bash in our case), two code trees were not synchronized, i.e. they corresponded to slightly different minor versions, which forced us to use tags rather than branches from the main code tree. Luckily, TeamCity allows building on a tag and the “Enable to use tags in the branch specification” option can be set in such case:

teamcity-vcs-tags-in-branch-specs-small

Dependencies

Here is another problem we faced. When running the first build, dpkg-buildpackage exits with code 3 even though all the required dependencies were installed (see the prereqs section above).

There are a few related nuances:

  • The most common case for continuous integration is building software from Debian Unstable or Debian Experimental. So, to meet all the dependencies required for the build, TeamCity agents themselves need to run under Debian Unstable or Debian Experimental (otherwise dpkg-buildpackage will be reporting that your stable dependencies versions are too old). To resolve the error, we added the -d parameter:
    dpkg-buildpackage -uc -us -d
  • A special case of old dependencies is the configure script, created by the GNU Autotools that are newer than those currently installed on your system. dpkg-buildpackage is unable to detect this, so if the build log shows messages about the missing m4 macros, you need to to re-generate the configure script using the of GNU Autotools currently installed on the agent. This was done by adding the following command as the build step executed before dpkg-buildpackage:
    autoreconf -i

Broken unit tests

When working with Debian Unstable or Debian Experimental, unit test may fail (as it happened in our case). We choose to ignore the failing test and still build the package by running dpkg-buildpackage in a modified environment:
DEB_BUILD_OPTIONS=nocheck dpkg-buildpackage -uc -us

Other build profiles are described here.

Final Stage

After tuning all of the build configurations, our builds finally yielded expected artifacts (the dpkg package is used as an example):
11-teamcity-debian-artifacts

If you do not want each incremental package version to increase the number of artifacts of a single build (giving you dpkg_1.18.16_i386.deb, dpkg_1.18.17_i386.deb, etc.), the working directory should be selectively cleaned up before starting a new build. This was done by adding the TeamCity Swabra build feature to our build configurations.

Tuning up Debian repository

The tcDebRepository plugin adds the “Debian Repositories” tab in the project settings screen, which allows you to create a Debian repository. Once the repository is created, artifact filters need to be configured: at the moment each filter is added manually. Filters can be edited, deleted or copied.
teamcity-adding-an-artifact-filter

The existing artifacts will not be indexed, therefore after the configuration of the Debian repository, at least one build must be run in every build configuration. Then we can view the available indexed packages:
16-teamcity-debian-debrepo-page-2

When adding the repository to the /etc/apt/sources.list, all these packages are visible on the client side. Note that the packages are not digitally signed, which prevents packages from being available on recent versions of Ubuntu. Package signing is planned for tcDebRepository version 1.1.

17-teamcity-debian-aptitude-1

(!) If you are compiling for several architectures (i386, x32, amd64, arm*), it is worth having several build configurations corresponding to the same package with different agent requirements, or, in addition to the VCS Trigger, using the Schedule Trigger with the “Trigger build on all enabled and compatible agents” option enabled.

20-teamcity-debian-change-log

Happy building!

* We’d like to thank netwolfuk , the author of the tcDebRepository  plugin, for contributing to this publication.
This article, based on the original post in Russian, was translated by Julia Alexandrova.

Kotlin Configuration Scripts: Testing Configuration Scripts

$
0
0

This is part five of the five-part series on working with Kotlin to create Configuration Scripts for TeamCity.

  1. An Introduction to Configuration Scripts
  2. Working with Configuration Scripts
  3. Creating Configuration Scripts dynamically
  4. Extending the TeamCity DSL
  5. Testing Configuration Scripts

In this last part of the series we’re going to cover one aspect that using Kotlin Configurations Scripts enables, which is testing.

Given that the script is a programming language, we can simply add a dependency to a testing framework of our choice, set a few parameters and start writing tests for different aspects of our builds.

In our case, we’re going to use JUnit. For this, we add the JUnit dependency to the pom.xml file

<dependency>
      <groupId>junit</groupId>
      <artifactId>junit</artifactId>
      <version>4.12</version>
</dependency>

We also need to define the test directory

<sourceDirectory>Wasabi</sourceDirectory>
<testSourceDirectory>tests</testSourceDirectory>

In our case, this corresponds to the following directory layout

Directory Structure

Once we have this in place, we can write unit tests like in any other Kotlin or Java project, accessing the different components of our project, build types, etc. In our case we’re going to write a simple test that checks to see all build types start with a clean checkout

@Test
fun buildsHaveCleanCheckOut() {
    val project = Project
    project.buildTypes.forEach { bt ->
        assertTrue(bt.vcs.cleanCheckout ?: false, "BuildType '${bt.extId}' doesn't use clean checkout")
    }
}


That additional layer of certainty

When we make changes to the Kotlin Configuration Script and check it in to source control, TeamCity synchronises the changes and it will report of an errors it encounters, which usually are related to compilation. The ability to now add tests allow us to add another extra layer of checks to make sure that beyond our build script containing any scripting errors, certain things are validated such as the correct VCS checkout as we’ve seen above, whether the appropriate number of build steps are being defined, etc. The possibilities are essentially endless given that once again, we’re just using a regular programming language.

Update: Important note

Given that currently TeamCity does not fetch third-party dependencies, the tests, which usually require JUnit or some other testing framework, will fail if places inside the .teamcity folder. This is due to TeamCity syncing the project and failing to compile unresolved references. For now the workaround is to place the tests outside of this folder.

Deploying TeamCity into AWS using CloudFormation and Fargate

$
0
0

For the good cause, it is sometimes easier to start with TeamCity by deploying it into a cloud service, such as AWS. This allows the users to try TeamCity without the need to prepare the dedicated machine.

For the quick start, it is possible to use CloudFormation template which deploys the minimal setup to AWS. For the agents, TeamCity includes the integration for Amazon EC2 out of the box. However, there is also an alternative way to start the agents as Docker containers at Amazon’s Elastic Container Services platform.

In this article, we’re going to describe how to deploy TeamCity server using the CloudFormation template and how to configure the agents to run on Amazon ECS with Fargate.

Deploying TeamCity server to AWS with CloudFormation template

The official TeamCity CloudFormation template is available to simplify deployment to AWS. The resulting implementation will start a VM with two Docker containers: one for TeamCity server, and the other for the default agent.

DISCLAIMER: The current configuration of the CloudFormation template is not recommended for production setup. The default agent is configured to run on the same machine as the TeamCity server. Instead, it is advised to run the agents separately in order not to consume the machine resources required by the server.

Deploy TeamCity to AWS using CloudFormation template

Once a TeamCity server is deployed, check the Outputs tab for the URL. After the initial configuration steps, it is possible to add more build agents to the server. There are multiple options for TeamCity agents deployment at AWS. In the following, we’ll describe how to deploy the agent to Amazon ECS with Fargate.

AWS Fargate for TeamCity Agents

AWS Fargate is a technology for Amazon ECS that allows us to run containers without having to manage servers. TeamCity agent can be deployed as a container to ECS by using Fargate.

The short-lived container instances at ECS are perfectly suitable for executing build tasks. For TeamCity, it means that it is possible to acquire more resources dynamically. Once more agents are required to process the build queue TeamCity will request a new agent to start via Fargate. The agents can stop once the workload isn’t as high anymore.

To run TeamCity agents at Amazon ECS with Fargate several steps needs to be fulfilled:

  1. Have a running TeamCity server instance
  2. Install the required plugins for TeamCity server
  3. Create task definition for TeamCity agent in Amazon ECS
  4. Create cloud agent profile for the project in TeamCity
  5. Optionally, configure S3 artifact storage for the project in TeamCity

Installing Plugins

The required integration with various AWS services activates by installing the additional plugins to TeamCity server. To make use of AWS Fargate integration in TeamCity the Amazon ECS Support plugin needs to be installed. Also, one might want to consider storing the build artifacts in Amazon S3 as well. AWS S3 Artifact Storage plugin enables the integration.

Once the plugins are installed, we can proceed to the configuration.

Agents Configuration

Create AWS Fargate task definition

TeamCity agent is available as a Docker image via Docker Hub. In the Fargate task definition, it is possible to define a container, referring to that image. Once the server requests for a new agent via Fargate, a new container will start on Amazon ECS.

The important bit is to add SERVER_NAME environment variable pointing at the URL of the TeamCity server. The agent will use that variable to connect to the server.

Create Fargate task definition

Create cloud profile for a project in TeamCity

To enable cloud integration in TeamCity one has to create a cloud profile for the desired project. Configuring cloud profile in TeamCity is quite straightforward.

Go to the project settings, the Cloud Profiles tab, click “Create new cloud profile” button and proceed with the configuration. Make sure to select Amazon Elastic Container Service as the cloud type.

It is also important that the selected AWS region in the cloud profile matches the region that you used to create the Fargate task definition.

In order to point the cloud profile at the task definition in Farget we have to add an agent image with the appropriate launch type.

Create Fargate task definition

Artifact Storage Configuration

In TeamCity, a build configuration can expose the resulting artifacts. It is wise to store the artifacts in the external storage. We can use Amazon S3 to save the files. Let’s see how to configure the service for TeamCity.

In the project settings, navigate to the Artifacts Storage Project tab and click the “Add new storage” button. Select “S3 Storage” type and fill in the name, bucket name and press Save. After that, activate this artifact storage in the TeamCity project by clicking the “Make Active” link. The new builds in this project will store artifacts in S3 automatically.

S3 artifact storage configuration

Summary

TeamCity was designed as on-premise solution. However, cloud services, such as AWS, simplify the setup if you would like to try TeamCity for your projects. It is easy to start with the CloudFormation template and scale by deploying the agents as Docker containers at Amazon ECS.

Configuration as Code, Part 1: Getting Started with Kotlin DSL

$
0
0

Configuration as code is a well-established practice for CI servers. The benefits of this approach include versioning support via VCS repository, a simplified audit of the configuration changes, and improved portability of the configurations. Some users may also prefer code to configuring the builds with point-and-click via UI. In TeamCity, we can use Kotlin DSL to author build configurations.

The possibility to use Kotlin for defining build configurations was added in TeamCity 10. In TeamCity 2018.x Kotlin support was greatly improved for a more pleasant user experience.

In this series of posts, we are going to explain how to use Kotlin to define build configurations for TeamCity. We will start with the basics on how to get started with configuration-as-code in TeamCity. We will then dive into the practicalities of using Kotlin DSL for build configurations. Finally, we will take a look at advanced topics such as extending the DSL.

  1. Getting started with Kotlin DSL
  2. Working with configuration scripts
  3. Creating build configurations dynamically
  4. Extending Kotlin DSL
  5. Using libraries
  6. Testing configuration scripts

The demo application

In this tutorial, we are going to use the famous spring-petclinic project for demonstration. Spring Petclinic is a Java project that uses Maven for the build. The goal of this post is to demonstrate an approach for building an existing application with Kotlin DSL.

It is best to add a Kotlin DSL configuration to an existing project in TeamCity. First, create a new project in TeamCity by pointing to a repository URL. For our demo project, TeamCity will detect the presence of the Maven pom.xml and propose the required build steps. As a result, the new project will include one VCS root and a build configuration with a Maven build step and a VCS trigger.

New project for Spring Petclinic

The next step for this project is transitioning to configuration-as-code with Kotlin DSL. To do that, we have to enable Versioned Settings in our project.

WARNING! Once you enable Versioned Settings for the project, TeamCity will generate the corresponding files and immediately commit/push them into the selected repository.

Enable Versioned Settings

To start using Kotlin build scripts in TeamCity the Versioned Settings have to be enabled. Regardless of whether you are starting from scratch or you have an existing project. In the project configuration, under Versioned Settings, select the Synchronization enabled option, select a VCS root for the settings, and choose Kotlin format.

The VCS root selected to store the settings can be the same as the source code of the application you want to build. For our demo, however, we are going to use a specific VCS root dedicated to only the settings. Hence, there will be 2 VCS roots in the project: one for source code of the application and the other for build settings.

TeamCity Versioned Settings

In addition to this, it is possible to define which settings to take when the build starts. When we use Kotlin DSL and make changes to the scripts in our favorite IDE, the “source of truth” is located in the VCS repository. Hence, it is advised to enable the use settings from VCS option. The changes to the settings are then always reflected on the server.

Once the Versioned Settings are enabled, TeamCity will generate the corresponding script and commit to the selected VCS root. Now we can pull the changes from the settings repository and start editing.

Opening the configuration in IntelliJ IDEA

The generated settings layout is a .teamcity directory with two files: settings.kts and pom.xml. For instance, the following are the files checked in to version control for the spring-petclinic application.

Clone the demo repository:

git clone https://github.com/antonarhipov/spring-petclinic-teamcity-dsl.git

Open the folder in IntelliJ IDEA, you will see the following layout:

TeamCity Kotlin DSL project layout

Essentially, the .teamcity folder is a Maven module. Right-click on the pom.xml file and select Add as Maven Project – the IDE will import the Maven module and download the required dependencies.

add-as-maven-project

pom.xml

The TeamCity specific classes that we use in the Kotlin script are coming from the dependencies that we declare in the pom.xml as part of the Maven module. This is a standard pom.xml file, besides that, we have to pay attention to a few things.

The DSL comes in a series of packages with the main one being the actual DSL which is contained in the configs-dsl-kotlin-{version}.jar file. Examining it, we can see that it has a series of classes that describe pretty much the entire TeamCity user interface.

kotlin-dsl-library

The other dependencies that we see in the list are the Kotlin DSL extensions contributed by TeamCity plugins.

kotlin-dsl-dependencies

Some of the dependencies are downloaded from JetBrains’ own Maven repository. However, the plugins you have installed on your TeamCity instance may provide the extensions for the DSL, and therefore our pom.xml needs to pull the dependencies from the corresponding server. This is why you can find an additional repository URL in the pom.xml file.

The source directory is also redefined in this pom.xml since in many cases there will be just one settings.kts file. There is not much use for the standard Maven project layout here.

settings.kts

kts is a Kotlin Script file, different from a Kotlin file (.kt) in that it can be run as a script. All the code relevant to the TeamCity configuration can be stored in this file, but it can also be divided into several files to provide a better separation of concerns. Imports omitted, this is how the settings.kts for our demo project looks:

settings-kts

version indicates the TeamCity version, and project() is the main entry point to the configuration script. It is a function call, which takes as a parameter a block that represents the entire TeamCity project. In that block, we compose the structure of the project.

The vcsRoot(...) function call registers a predefined VCS root to the project. The buildType(...) function registers a build configuration. As a result, there is one project, with one VCS root, and one build configuration declared in our settings.kts file.

The corresponding objects for VCS root and the build configuration are declared in the same script.

Build configuration

The Build object inherits from the BuildType class that represents the build configuration in TeamCity. The object is registered in the project using a buildType(...) function call.

The declarations in the object are self-explanatory: you can see the name of the build configuration, artifact rules, the related VCS root, build steps, and triggers. There are more possibilities that we can use, which we will cover in further posts.

Kotlin Build Configuration

VCS root

The VCS root object, PetclinicVcs, is a very simple one in our example. It has just two attributes: the name, and the URL of the repository.

kotlin-dsl-vcs-root

The parent type of the object, GitVcsRoot, indicates that this is a git repository that we’re going to connect to.

There are more attributes that we can specify for the VCS root object, like branches specification, and authentication type if needed.

Import project with the existing Kotlin script

It is possible to import existing Kotlin settings. When creating the project from a repository URL, TeamCity will scan the sources. If existing Kotlin settings are detected, the wizard will suggest importing them.

Import from Kotlin DSL

You can then decide if you want to just import the project from the settings, import and enable the synchronization with the VCS repository, or proceed without the import.

Summary

In this part of the series, we’ve looked at how to get started configuring the builds in TeamCity with Kotlin DSL. We explored the main components of a TeamCity configuration script and its dependencies. In part two, we’ll dive a little deeper into the DSL, modify the script, and see some of the benefits that Kotlin and IntelliJ IDEA already start providing us with in terms of guidance via code assistants.

Configuration as Code, Part 2: Working with Kotlin Scripts

$
0
0

This is part two of the six-part series on working with Kotlin to create build configurations for TeamCity.

  1. Getting started with Kotlin DSL
  2. Working with configuration scripts
  3. Creating build configurations dynamically
  4. Extending Kotlin DSL
  5. Using libraries
  6. Testing configuration scripts

In the first part of the series, we have seen how to get started with Kotlin DSL for TeamCity. Now we’ll dive a little deeper into the DSL and see what it provides us with in terms of building configuration scripts.

An important thing to note is that TeamCity 2018.x uses Kotlin version 1.2.50.

Configuration script

Because the configuration is actually a valid Kotlin program, we get to use all the assistance from the IDE – code completion, refactoring, and navigation.

Editing settings.kts

As we saw in the previous post, the entry point to the configuration is the project {...} function call defined in settings.kts. Let’s examine the individual blocks of the script.

Project

The top-level project element in the settings.kts file represents a top-level context for all the build configurations and subprojects that are declared within the scope.

project {
}

A top-level project does not need to have an id or a name. These attributes are defined when we register a new project in TeamCity.

A project in TeamCity may include sub-projects and build configurations. A sub-project should be registered in the main context using the subProject function:

project {
   subProject(MyProject)
}

We also can register a few other entities, like one or more VCS roots and build configurations.

project {
   vcsRoot(PetclinicVcs)
   buildType(Build)
}

The above exactly matches our demo project configuration script. PetclinicVcs and Build objects represent a VCS root and build configuration – this is where the build happens!

Build configuration

The build configuration is represented by a BuildType class in TeamCity’s Kotlin DSL. To define a new build configuration we define an object that derives from the BuildType.

object Build: BuildType({
   
})

The constructor of BuildType receives a block of code, enclosed within the curly braces {}. This is where we define all the required attributes for the build configuration.

object Build: BuildType({
   id(“Build”)
   name = “Build”

   vcs {
     root(PetclinicVcs)
   }
   
   steps {
     maven {
       goals = “clean package”
     }
   }
 
   triggers {
      vcs {}
   }
})

Let’s examine the individual configuration blocks in the example above.

The id and name

The first lines in the Build object denote its id and name. The id, if not specified explicitly, will be derived from the object name.

Configuration id and name

Version control settings

The vcs{} block is used to define the version control settings, including the list of VCS roots and other attributes.

vcs settings

Build steps

After VCS settings block you will find the most important block, steps{}, where we define all the required build steps.

In our example, for a simple Maven project, we only define one Maven build step with clean and package goals.

steps {
     maven {
       goals = “clean package”

       //Other options
       dockerImage = “maven:3.6.0-jdk-8”
       jvmArgs = “-Xmx512”
       //etc
     }
}

maven build step

Besides Maven, there are plenty of other build steps to choose from in TeamCity. Here are a few examples:

Gradle build step

gradle {
    tasks = “clean build”
}

Command line runner

script {
    scriptContent = “echo %build.number%”
}

Ant task with inline build script

ant {
    mode = antScript {
        content = """
            <?xml version="1.0" encoding="UTF-8">
            <project name="echoMessage">
            <target name="sayHello">
              <echo message="Hello, world!"/>
            </target>
            </project>  
        """.trimIndent()
    }
    targets = "sayHello"
}

Docker command

dockerCommand {
    commandType = build {
        source = path {
            path = "Dockerfile"
        }
        namesAndTags = "antonarhipov/myimage:%build.number%"
        commandArgs = "--pull"
    }
}

Finding a DSL snippet for a build step

Despite the IDE support for Kotlin it might still be a bit challenging for new users to configure something in the code. “How do I know how to configure the desired build step and what are the configuration options for that?” Have no fear – TeamCity can help with that! For a build configuration, find the View DSL toggle on the left-hand side of the screen:

Preview Kotlin DSL toggle

The toggle will provide a preview of the given build configuration, here you can locate the build step that you want to configure. Say, we’d like to add a new build step for building a Maven module.

Add a new build step, choose Maven, fill in the attributes, and without saving the build step – click on the toggle to preview the build configuration. The new build step will be highlighted as follows:

Preview Kotlin DSL

You can now copy the code snippet and paste it to the configuration script opened in your IDE.

Please note that If you save the new build step for a project that is already configured via Kotlin DSL scripts — this is allowed — TeamCity will generate a patch and commit it to the settings VCS root. It is then the user’s responsibility to merge the patch into the main Kotlin script.

The VCS root

Besides the build configuration, our demo project also includes a VCS root definition that the build configuration depends on.

object PetclinicVcs : GitVcsRoot({
   name = "PetclinicVcs"
   url = "https://github.com/spring-projects/spring-petclinic.git"
})

This is a minimal definition of the VCS root for a Git repository. The id attribute is not explicitly specified here, hence it is calculated automatically from the object’s name. The name attribute is required for displaying in the UI, and the url defines the location of the sources.

Depending on the kind of VCS repository we have, we may specify other attributes as well.

vcs root

Modifying the build process

Let’s extend this build a little bit. TeamCity provides a feature called Build Files Cleaner, also known as Swabra. Swabra makes sure that files left by the previous build are removed before running new builds.

We can add it using the features function. As we start to type, we can see that the IDE provides us with completion:

swabra in Kotlin DSL

The features function takes a series of feature functions, each of which adds a particular feature. In our case, the code we’re looking for is

features {
   swabra {
   }
}

In UI, you will find the result in the Build Features view:

swabra in build features

We have now modified the build configuration, and it works well. The problem is, if we want to have this feature for every build configuration, we’re going to end up repeating the code. Let’s refactor it to a better solution.

Refactoring the DSL

What we’d ideally like is to have every build configuration automatically have the Build Files Cleaner feature, without having to manually add it. In order to do this, we could introduce a function that wraps every instance of BuildType with this feature. In essence, instead of having the Project call

buildType(Build)
buildType(AnotherBuild)
buildType(OneMoreBuild)

we would have it call

buildType(cleanFiles(Build))
buildType(cleanFiles(AnotherBuild))
buildType(cleanFiles(OneMoreBuild))

For this to work, we’d need to create the following function

fun cleanFiles(buildType: BuildType): BuildType {
   buildType.features {
       swabra {}
   }
   return buildType
}

The new function essentially takes a BuildType, adds a feature to it, and then returns the BuildType. Given that Kotlin allows top-level functions (i.e. no objects or classes are required to host a function), we can put it anywhere in the code or create a specific file to hold it.

We can improve the code a little so that it only adds the feature if it doesn’t already exist:

fun cleanFiles(buildType: BuildType): BuildType {
   if (buildType.features.items.find { it.type == "swabra" } == null) {
       buildType.features {
           swabra {
           }
       }
   }
   return buildType
}

Generalizing feature wrappers

The above function is great in that it allows us to add a specific feature to all the build configurations. What if we wanted to generalize this so that we could define the feature ourselves? We can do so by passing a block of code to our cleanFiles function, which we’ll also rename to something more generic.

What we’re doing here is creating what’s known as a higher-order function, a function that takes another function as a function. In fact, this is exactly what features, feature, and many of the other TeamCity DSL’s are.

fun wrapWithFeature(buildType: BuildType, featureBlock: BuildFeatures.() -> Unit): BuildType {
   buildType.features {
       featureBlock()
   }
   return buildType
}

One particular thing about this function, however, is that it’s taking a special function as a parameter, which is an extension function in Kotlin. When passing in this type of parameter, we refer to it as Lambdas with Receivers (i.e. there is a receiver object that the function is applied on).

buildType(wrapWithFeature(Build){
   swabra {}
})

This then allows us to make calls to this function in a nice way, referencing feature directly.

Summary

In this post, we’ve seen how we can modify TeamCity configuration scripts using the extensive Kotlin-based DSL. What we have in our hands is a full programming language along with all the features and power that it provides. We can encapsulate functionality in functions to re-use, we can use higher-order functions as well as other things that open up many possibilities.

In the next post, we’ll see how to use some of this to dynamically create scripts.

Configuration as Code, Part 3: Creating Build Configurations Dynamically

$
0
0

This is part three of the six-part series on working with Kotlin to create build configurations for TeamCity.

  1. Getting started with Kotlin DSL
  2. Working with configuration scripts
  3. Creating build configurations dynamically
  4. Extending Kotlin DSL
  5. Using libraries

We have seen in the previous post how we can leverage some of Kotlin’s language features to reuse code. In this part, we’re going to take advantage of the fact that we are dealing with a full programming language and not just a limited DSL, to create a dynamic build configuration.

Generating build configurations

The scenario is the following: we have a Maven project that we need to test on different operating systems and different JDK versions. This potentially generates a lot of different build configurations that we’d need to create and maintain.

Here’s an example configuration for building a Maven project:

version = "2018.2"

project {
    buildType(BuildForMacOSX)
}

object BuildForMacOSX : BuildType({
   name = "Build for Mac OS X"

   vcs {
       root(DslContext.settingsRoot)
   }

   steps {
       maven {
           goals = "clean package"
           mavenVersion = defaultProvidedVersion()
           jdkHome = "%env.JDK_18%"
       }
   }

   requirements {
       equals("teamcity.agent.jvm.os.name", "Mac OS X")
   }
})

If we try to create each individual configuration for all the combinations of OS types and JDK versions we will end up with a lot of code to maintain. Instead of creating each build configuration manually, what we can do is write some code to generate all the different build configurations for us.

A very simple approach we could take here is to have two lists with the versions of OS types and JDK versions, and then iterate over them to generate the build configurations:

val operatingSystems = listOf("Mac OS X", "Windows", "Linux")
val jdkVersions = listOf("JDK_18", "JDK_11")

project {
   for (os in operatingSystems) {
       for (jdk in jdkVersions) {
           buildType(Build(os, jdk))
       }
   }
}

We need to adjust our build configuration a little to use the parameters. Instead of an object, we will declare a class with a constructor that will accept the parameters for the OS type and JDK version.

class Build(val os: String, val jdk: String) : BuildType({
   id("Build_${os}_${jdk}".toExtId())
   name = "Build ($os, $jdk)"

   vcs {
       root(DslContext.settingsRoot)
   }

   steps {
       maven {
           goals = "clean package"
           mavenVersion = defaultProvidedVersion()
           jdkHome = "%env.${jdk}%"
       }
   }

   requirements {
       equals("teamcity.agent.jvm.os.name", os)
   }
})

An important thing to notice here is that we are now setting the id of the build configuration explicitly using the id(...) function call, e.g. id("Build_${os}_${jdk}".toExtId())
Since the id shouldn’t contain any other characters the DSL library provides a toExtId() function that can be used to sanitize the value that we want to assign.

The result of this is that we will see 6 build configurations created:

Dynamic configurations

Summary

The above is just a sample of what can be done when creating dynamic build scripts. In this case, we created multiple build configurations, but we could have just as easily created multiple steps, certain VCS triggers, or whatever else that might come in useful. The important thing to understand is that at the end of the day, Kotlin Configuration Script isn’t just merely a DSL but a fully fledged programming language.

Configuration as Code, Part 4: Extending the TeamCity DSL

$
0
0
  1. Getting started with Kotlin DSL
  2. Working with configuration scripts
  3. Creating build configurations dynamically
  4. Extending Kotlin DSL
  5. Using libraries

TeamCity allows us to create build configurations that are dependent on one another, with the dependency being either snapshots or artifacts. The configuration for defining dependencies is done at the build configuration level. For instance, assuming that we have a build type Publish, that has a snapshot and artifact dependencies on Package, we would define this in the build type Publish in the following way:

object Package : BuildType({
   name = "Package"

   artifactRules = “application.zip”

   steps {
       // define the steps needed to produce the application.zip
   }
})

object Publish: BuildType({
   name="Publish"

   steps {
       // define the steps needed to publish the artifacts
   }

   dependencies {
       snapshot(Package){}
       artifacts(Package) {
           artifactRules = "application.zip"
       }
   }
})

and in turn, if Package had dependencies on previous build configurations, we’d define these in the dependencies segment of its build configuration.

TeamCity then allows us to visually see this using the Build Chains tab in the user interface:

build chains

The canonical approach to defining build chains in TeamCity is when we declare the individual dependencies in the build configuration. The approach is simple but as the number of build configurations in the build chain grows it becomes harder to maintain the configurations.

Imagine there’s a large number of build configurations in the chain, and we want to add one more somewhere in the middle of the workflow. For this to work, we have to configure the correct dependencies in the new build configuration. But we also need to update the dependencies in the existing build configurations to point at the new one. This approach does not seem to scale well.

But we can work around this problem by introducing our own abstractions in TeamCity’s DSL.

Defining the pipeline in code

What if we had a way to describe the pipeline on top of the build configurations that we define separately in the project? The pipeline abstraction is something we need to create ourselves. The goal of this abstraction is to allow us to omit specifying the snapshot dependencies in the build configurations that we want to combine into a build chain.

Assume that we have a few build configurations: Compile, Test, Package, and Publish. Test needs a snapshot dependency on Compile, Package depends on Test, Publish depends on Package, and so on. So these build configurations compose a build chain.

Let’s define, how the new abstraction would look. We think of the build chain described above as of a “sequence of builds”. So why not to describe it as follows:

project {
    sequence {
        build(Compile)
        build(Test)
        build(Package)
        build(Publish)
    }
}

Almost immediately, we could think of a case where we need to be able to run some builds in parallel.

project {
    sequence {
        build(Compile)
        parallel {
            build(Test1)
            build(Test2)
        } 
        build(Package)
        build(Publish)
    }
}

In the example above, Test1 and Test2 are defined in the parallel block, both depend on Compile. Package depends on both, Test1 and Test2. This can handle simple but common kinds of build chains where a build produces an artifact, several builds test it in parallel and the final build deploys the result if all its dependencies are successful.

For our new abstraction, we need to define, what sequence, parallel, and build are. Currently, the TeamCity DSL does not provide this functionality. But that’s where Kotlin’s extensibility proves quite valuable, as we’ll now see.

Creating our own DSL definitions

Kotlin allows us to create extension functions and properties, which are the means to extend a specific type with new functionality, without having to inherit from them. When passing extension functions as arguments to other functions (i.e. higher-order functions), we get what we call in Kotlin Lambdas with Receivers, something we’ve seen already in this series when Generalising feature wrappers in the second part of this series. We will apply the same concept here to create our DSL.

class Sequence {
   val buildTypes = arrayListOf<BuildType>()

   fun build(buildType: BuildType) {
       buildTypes.add(buildType)
   }
}

fun Project.sequence(block: Sequence.() -> Unit){
   val sequence = Sequence().apply(block)

   var previous: BuildType? = null

   // create snapshot dependencies
   for (current in sequence.buildTypes) {
       if (previous != null) {
           current.dependencies.snapshot(previous){}
       }
       previous = current
   }

   //call buildType function on each build type
   //to include it into the current Project
   sequence.buildTypes.forEach(this::buildType)
}

The code above adds an extension function to the Project class and allow us to declare the sequence. Using the aforementioned Lambda with Receivers feature we declare that the block used as a parameter to the sequence function will provide the context of the Sequence class. Hence, we will be able to call the build function directly within that block:

project {
    sequence {
         build(BuildA)
         build(BuildB) // BuildB has a snapshot dependency on BuildA
    }
}

Adding parallel blocks

To support the parallel block we need to extend our abstraction a little bit. There will be a serial stage that consists of a single build type and a parallel stage that may include many build types.

interface Stage

class Single(val buildType: BuildType) : Stage

class Parallel : Stage {
   val buildTypes = arrayListOf<BuildType>()

   fun build(buildType: BuildType) {
       buildTypes.add(buildType)
   }
}

class Sequence {
   val stages = arrayListOf<Stage>()

   fun build(buildType: BuildType) {
       stages.add(Single(buildType))
   }

   fun parallel(block: Parallel.() -> Unit) {
       val parallel = Parallel().apply(block)
       stages.add(parallel)
   }
}

To support the parallel blocks we will need to write slightly more code. Every build type defined in the parallel block will have a dependency on the build type which was declared before the parallel block. And the build type declared after the parallel block will depend on all the build types declared in the block. We’ll make the assumption that a parallel block cannot follow a parallel block, though it’s not a big problem to support this feature.

fun Project.sequence(block: Sequence.() -> Unit) {
   val sequence = Sequence().apply(block)

   var previous: Stage? = null

   for (current in sequence.stages) {
       if (previous != null) {
           createSnapshotDependency(current, previous)
       }
       previous = current
   }

   sequence.stages.forEach {
       if (it is Single) {
           buildType(it.buildType)
       }
       if (it is Parallel) {
           it.buildTypes.forEach(this::buildType)
       }
   }
}

fun createSnapshotDependency(stage: Stage, dependency: Stage){
   if (dependency is Single) {
       stageDependsOnSingle(stage, dependency)
   }
   if (dependency is Parallel) {
       stageDependsOnParallel(stage, dependency)
   }
}

fun stageDependsOnSingle(stage: Stage, dependency: Single) {
   if (stage is Single) {
       singleDependsOnSingle(stage, dependency)
   }
   if (stage is Parallel) {
       parallelDependsOnSingle(stage, dependency)
   }
}

fun stageDependsOnParallel(stage: Stage, dependency: Parallel) {
   if (stage is Single) {
       singleDependsOnParallel(stage, dependency)
   }
   if (stage is Parallel) {
       throw IllegalStateException("Parallel cannot snapshot-depend on parallel")
   }
}

fun parallelDependsOnSingle(stage: Parallel, dependency: Single) {
   stage.buildTypes.forEach { buildType ->
       singleDependsOnSingle(Single(buildType), dependency)
   }
}

fun singleDependsOnParallel(stage: Single, dependency: Parallel) {
   dependency.buildTypes.forEach { buildType ->
       singleDependsOnSingle(stage, Single(buildType))
   }
}

fun singleDependsOnSingle(stage: Single, dependency: Single) {
   stage.buildType.dependencies.snapshot(dependency.buildType) {}
}

The DSL now supports parallel blocks in the sequence:

parallel {
  sequence {
    build(Compile)
    parallel {
       build(Test1)
       build(Test2)
    }
    build(Package)
    build(Publish)
  }
}

basic-parallel-blocks

We could extend the DSL even further to support nesting of the blocks by allowing defining the sequence inside the parallel blocks.

project {
   sequence {
       build(Compile) 
       parallel {
           build(Test1) 
           sequence {
              build(Test2) 
              build(Test3)
           } 
       }
       build(Package) 
       build(Publish) 
   }
}

sequence-in-parallel

Nesting the blocks allows us to create build chains of almost any complexity. However, our example only covers snapshot dependencies. We haven’t covered artifact dependencies here yet and these would be nice to see in the sequence definition as well.

Adding artifact dependencies

For passing an artifact dependency from Compile to Test, simply specify that Compile produces the artifact and Test requires the same artifact.

sequence {
   build(Compile) {
      produces("application.jar")
   }
   build(Test) {
      requires(Compile, "application.jar")
   }
}

produces and requires are the new extension functions for the BuildType:

fun BuildType.produces(artifacts: String) {
   artifactRules = artifacts
}

fun BuildType.requires(bt: BuildType, artifacts: String) {
   dependencies.artifacts(bt) {
       artifactRules = artifacts
   }
}

We also need to provide a way to execute these new functions in the context of BuildType. For this, we can override the build() function of the Sequence and Parallel classes to accept the corresponding block by using Lambda with Receivers declaration:

fun Sequence.build(bt: BuildType, block: BuildType.() -> Unit = {}){
   bt.apply(block)
   stages.add(Single(bt))
}

fun Parallel.build(bt: BuildType, block: BuildType.() -> Unit = {}){
   bt.apply(block)
   stages.add(Single(bt))
}

As a result, we can define a more complex sequence with our brand new DSL:

sequence {
   build(Compile) {
       produces("application.jar")
   }
   parallel {
       build(Test1) {
           requires(Compile, "application.jar")
           produces("test.reports.zip")
       }
       sequence {
           build(Test2) {
               requires(Compile, "application.jar")
               produces("test.reports.zip")
           }
           build(Test3) {
               requires(Compile, "application.jar")
               produces("test.reports.zip")
           }
       }
   }
   build(Package) {
       requires(Compile, "application.jar")
       produces("application.zip")
   }
   build(Publish) {
       requires(Package, "application.zip")
   }
}

Summary

It’s important to understand that this is just one of many ways in which we can define pipelines. We’ve used the terms sequence, parallel and build. We could just as well have used the term buildchain to align it better with the UI. We also added the convenience methods to the BuildType to work with the artifacts.

The ability to easily extend the TeamCity DSL with our own constructs, provides us with flexibility. We can create custom abstractions on top of the existing DSL to better reflect how we reason about our build workflow.

In the next post, we’ll see how to extract our DSL extensions into a library for further re-use.


Configuration as Code, Part 5: Using DSL extensions as a library

$
0
0
  1. Getting started with Kotlin DSL
  2. Working with configuration scripts
  3. Creating build configurations dynamically
  4. Extending Kotlin DSL
  5. Using libraries

In the previous post, we have seen how to extend TeamCity’s Kotlin DSL by adding new abstractions. If the new abstraction is generic enough, it would make sense to reuse it in different projects. In this post, we are going to look at how to extract the common code into a library. We will then use this library as a dependency in a TeamCity project.

Maven project and dependencies

In the first post of this series, we started out by creating an empty project in TeamCity. We then instructed the server to generate the configuration settings in Kotlin format.

The generated pom.xml file pointed at two repositories and a few dependencies. This pom.xml is a little excessive for our next goal, but we can use it as a base, and remove the parts that we don’t need for the DSL library.

The two repositories in the pom.xml file are jetbrains-all, the public JetBrains repository, and teamcity-server that points to the TeamCity server where we generated the settings. The reason why the TeamCity server is used as a repository for the Maven project is that there may be some plugins installed that extend the TeamCity Kotlin DSL. And we may want to use those extensions for configuring the builds.

However, for a library, it makes sense to rely on a minimal set of dependencies to ensure portability. Hence, we keep only those dependencies that are downloaded from the public JetBrains Maven repository and remove all the others. The resulting pom.xml lists only 3 libraries: configs-dsl-kotlin-{version}.jar, kotlin-stdlib-jdk8-{version}.jar, and kotlin-script-runtime-{version}.jar.

The code

It’s time to write some code! In fact, it’s already written. In the previous post, we have introduced the new abstraction, the sequence, to automatically configure the snapshot dependencies for the build configurations. We only need to put this code into a *.kt file in our new Maven project.

teamcity-pipelines-dsl-lib

We have published the example project on GitHub. Pipelines.kt lists all the extensions to the TeamCity DSL. That’s it! We now can build the library, publish it, and use it as a dependency in any TeamCity project with Kotlin DSL.

Using the library

The new library project is on GitHub, but we haven’t published it to any Maven repository yet. To add it as a dependency to any other Maven project we can use the awesome jitpack.io. The demo project demonstrates how the DSL library is applied.

Here’s how we can use the library:

1. Add the JitPack repository to the pom.xml file:

<repositories>
  <repository>
    <id>jitpack.io</id>
    <url>https://jitpack.io</url>
  </repository>
</repositories>

2. Add the dependency to the dependent DSL project’s pom.xml:

<dependencies>
  <dependency>
    <groupId>com.github.JetBrains</groupId>
    <artifactId>teamcity-pipelines-dsl</artifactId>
    <version>0.8</version>
  </dependency>
</dependencies>

The version is equal to a tag in the GitHub repository:

teamcity-pipelines-dsl-tags

Once the IDE has downloaded the dependencies, we are able to use the DSL extensions provided by the library. See settings.kts of the demo project for an example.

using-the-library

Summary

TeamCity allows adding 3rd-party libraries as Maven dependencies. In this post, we have demonstrated how to add a dependency on the library that adds extensions to the TeamCity Kotlin DSL.

Webinar: Getting Started With Building Plugins For Teamcity

$
0
0

Missing a feature in TeamCity? Build your own plugin! To learn how, join us Tuesday, April 30th, 16:00 CEST (11:00 AM EDT) for the Getting Started with TeamCity Plugins webinar.

webinar-14 (1)

The webinar introduces you to the ins and outs of plugin development for TeamCity. How to get started, where to find the docs and samples, what are the typical use cases, and even more importantly – where to ask the questions! We will develop a new plugin for TeamCity from scratch, explore the possible extension points, and discuss the essential concepts.

In this webinar:

  • Use the Maven archetype for TeamCity plugins
  • Applying TeamCity SDK for Maven
  • Overview of the typical plugins for TeamCity
  • TeamCity OpenAPI overview
  • Updating plugins with no server restarts

Space is limited, so please register now. There will be an opportunity to ask questions during the webinar.

Register for the webinar

Anton ArhipovAnton Arhipov is a Developer Advocate for JetBrains TeamCity. His professional interests include everything Java, but also other programming languages, middleware, and developer tooling. A Java Champion since 2014, Anton is also a co-organizer of DevClub.eu, a local developer community in Tallinn, Estonia.

Configuration as Code, Part 6: Testing Configuration Scripts

$
0
0

In this blog post, we are going to look at how to test TeamCity configuration scripts.

  1. Getting started with Kotlin DSL
  2. Working with configuration scripts
  3. Creating build configurations dynamically
  4. Extending Kotlin DSL
  5. Using libraries
  6. Testing configuration scripts

Given that the script is implemented with Kotlin, we can simply add a dependency to a testing framework of our choice, set a few parameters and start writing tests for different aspects of our builds.

In our case, we’re going to use JUnit. For this, we need to add the JUnit dependency to the pom.xml file

<dependency>
    <groupId>junit</groupId>
    <artifactId>junit</artifactId>
    <version>4.12</version>
</dependency>

We also need to define the test directory.

<testSourceDirectory>tests</testSourceDirectory>
<sourceDirectory>settings</sourceDirectory>

In this example, we have redefined the source directory as well, so it corresponds with the following directory layout.

Once we have this in place, we can write unit tests as we would in any other Kotlin or Java project, accessing the different components of our project, build types, etc.

However, before we can start writing any code we need to make a few adjustments to the script. The reason is that our code for the configuration resides in settings.kts file. The objects that we declared in the kts file are not visible in the other files. Hence, to make these objects visible, we have to extract them into a file (or multiple files) with a kt file extension.

First, instead of declaring the project definition as a block of code in the settings.kts file, we can extract it into an object:

version = "2018.2"

project(SpringPetclinic)

object SpringPetclinic : Project ({
   …
})

The SpringPetclinic object then refers to the build types, VCS roots, etc.

Next, to make this new object visible to the test code, we need to move this declaration into a file with a kt extension:

kotlin-dsl-test-code-in-files

settings.kts now serves as an entry point for the configuration where the project { } function is called. Everything else can be declared in the other *.kt files and referred to from the main script.

After the adjustments, we can add some tests. For instance, we could validate if all the build types start with a clean checkout:

import org.junit.Assert.assertTrue
import org.junit.Test

class StringTests {

   @Test
   fun buildsHaveCleanCheckOut() {
       val project = SpringPetclinic

       project.buildTypes.forEach { bt ->
           assertTrue("BuildType '${bt.id}' doesn't use clean checkout",
               bt.vcs.cleanCheckout)
       }
   }
}

Configuration checks as part of the CI pipeline

Running the tests locally is just one part of the story. Wouldn’t it be nice to run validation before the build starts?

When we make changes to the Kotlin configuration and check it into the source control, TeamCity synchronizes the changes and it will report any errors it encounters. The ability to now add tests allows us to add another extra layer of checks to make sure that our build script doesn’t contain any scripting errors and that certain things are validated such as the correct VCS checkout, as we’ve seen above, and the appropriate number of build steps are being defined, etc.

We can define a build configuration in TeamCity that will execute the tests for our Kotlin scripts prior to the actual build. Since it is a Maven project, we can apply Maven build step – we just need to specify the correct path to pom.xml, i.e. .teamcity/pom.xml.

kotlin-dsl-code-in-ci-pipeline

The successful run of the new build configuration is a prerequisite for the rest of the build chain. Meaning, if there are any JUnit test failures, then the rest of the chain will not be able to start.

Building GitHub pull requests with TeamCity

$
0
0

The support for pull requests in TeamCity was first implemented for GitHub as an external plugin. Starting with TeamCity version 2018.2 the plugin is bundled in the distribution package with no need to install the external plugin. The functionality has since been extended in version 2019.1 to support GitLab and BitBucket Server.

In this blog post, we will share some tips for building GitHub pull requests in TeamCity. First, there are a few things you need to know about when configuring the VCS root in regards to pull request handling. Next, we’ll cover Pull Requests and the Commit Status Publisher build features. And finally, we’ll see how it all comes together when building pull request branches.

Setting up a VCS root

First, let there be a VCS root in a TeamCity project. We can configure the VCS root in Build Configuration Settings | Version Control Settings and click Attach VCS root.

When setting up the VCS root we have to make sure that the branch specification does not match the pull request branches.

vcs-root

The branch specification in the screenshot above includes a +:refs/heads/feature-* filter. This means that any branch in the GitHub repository that starts with feature-* will be automatically detected by this VCS root. A pull request in GitHub is a git branch with a specific naming convention: refs/pull/ID/head, whereas the ID is the number of the pull request submitted to the repository.

It is possible to configure the VCS root to match the incoming pull request branches and TeamCity will start the builds automatically. However, you might want to restrict the automatic build triggering for these branches. Hence, it is better to avoid adding +:* or +:refs/pull/* patterns to the branch specification of a VCS root. Instead, we can use the Pull Requests build feature to gain more control over the incoming pull requests.

Configuring Pull Requests build feature

Pull request support is implemented as a build feature in TeamCity. The feature extends the VCS root’s original branch specification to include pull requests that match the specified filtering criteria.

To configure the pull requests support for a build configuration, go to Build Configuration Settings | Build Features, click Add build feature, and select the Pull Requests feature from the dropdown list in the dialog.

adding-build-feature

We can then configure the build feature parameters: select the VCS root, VCS hosting type (GitHub), credentials, and filtering criteria.

pull-requests-configuration

The Pull Requests build feature extends the branch specification of the related VCS root. As a result, the full list of branches that will be visible by the VCS root will include the following:

  • The default branch of the VCS root
  • Branches covered by the branch specification in the VCS root
  • Service-specific open pull request branches that match the filtering criteria, added by Pull Requests build feature

For GitHub’s pull request branches we can configure some filtering rules. For instance, we can choose to only build the pull requests automatically if they are submitted by a member of the GitHub organization.

In addition to this, we can also filter the pull requests based on the target branch. For instance, if the pull request is submitted to refs/head/master then the pull request branch will be visible in the corresponding VCS root. The pull request branches whose target branch does not match the value specified in the filter will be filtered out.

Publishing the build status to GitHub

For better transparency in the CI workflow, it is useful to have an indication of the build status from the CI server next to revision in the source control system. So when we look at a specific revision in the source control system we can immediately tell if the submitted change has been verified at the CI server. Many source control hosting services support this functionality and TeamCity provides a build feature to publish the build status into external systems, the Commit Status Publisher.

commit-status-publisher

The build status indication is useful when reviewing the pull requests submitted to a repository on GitHub. It is advisable to configure the Commit Status Publisher build feature in TeamCity if you are working with pull requests.

Triggering the builds

The Pull Requests build feature makes the pull request branches visible to the related VCS root. But it does not trigger the builds. In order to react to the changes detected by the VCS root we need to add a VCS trigger to the build configuration settings.

To add the VCS trigger to a build configuration, go to Build Configuration Settings | Version Control Settings, click Add new trigger, and select the VCS trigger from the list.

vcs-trigger

The default value in the branch filter of the VCS trigger is +:*. It means that the trigger will react to the changes in all the branches that are visible in the VCS roots attached to the same build configuration. Consequently, when a pull request is submitted, the trigger will apply and the build will start for the pull request branch.

Building pull requests

Once the Pull Requests build feature is configured we can try submitting a change to a GitHub repository:

pr1

When the new pull request is created, we can choose the branch in the target repository. This is the branch we can filter in the Pull Requests build feature settings in TeamCity.

pr2

Once the pull request is submitted, TeamCity will detect that there’s a new branch in the GitHub repository and will start the build.

building-pr

The build overview page in TeamCity provides additional details about the pull request.

building-pr-info

The build status is also published to the GitHub repository by the Commit Status Publisher:

building-pr-status

Here is a short screencast demonstrating the process above:


Summary

Now the puzzle pieces are coming together. The Pull Requests build feature extends the branch specification of the VCS root to match the pull request branches. The VCS trigger detects that a new pull request was submitted to the GitHub repository and triggers the build. Once the build is complete, the Commit Status Publisher sends the build status back to GitHub.

Building Go programs in TeamCity

$
0
0

TeamCity provides support for multiple technologies and programming languages. In TeamCity 2019.1, support for Go has been included in the distribution. In this blog post, we will explain how to configure TeamCity to work with Go programs.

Configuring Golang build feature

To enable Go support in TeamCity, go to Build Configuration Settings | Build Features, click Add build feature, and select Golang from the list.

The Golang build feature enables the real-time reporting and history of Go test results in TeamCity.

golang-build-feature

Running Go tests

Once the Goland build feature is enabled, TeamCity will parse the JSON output of go test command. Hence, the command should be executed with a -json flag using one of these two methods:

  • Add this flag to the Command Line build runner’s script: go test -json
  • Add the env.GOFLAGS=-json parameter to the build configuration

go-build-step

In fact, since a lot of Go projects are actually using make to build the code and execute the tests, it will require changing the Makefile respectively:

test:
    go test -json ./... ; exit 0

The build feature is enabled and a -json argument is added to the go test command. We can now execute the build configuration. As a result, TeamCity will record data about the test execution status, execution time and present this data in the UI.

go-tests

For each individual test, it is possible to review its execution time from a historical perspective across different build agents where the test was executed.

Muting the failing tests

Assume that there are 248 tests in our project and 4 of those tests are failing. Meaning, the build does not succeed. However, we know that it is okay for those tests to fail and we would like to temporarily “mute” the specific test failures in the project. TeamCity provides a way to “mute” any of the currently failing tests so they will not affect the build status for future builds.

mute-tests

Muting test failures is a privilege of the project administrator. Select the individual failed tests in the build results and click the Investigate/Mute button that appears at the bottom of the screen. It is then possible to mute the tests either project-wide or just in the selected build configuration. The unmute policy can also be specified. For instance, once the test is fixed, it will automatically unmute.

build-with-muted-tests

But what does muting the test failure has to do with running Go tests? We use the go test command to execute the tests, and its exit code depends on the status of the execution. If there is even a single test failure, the exit code will be 1. The build will fail since the Command Line build step in TeamCity aims to respect the exit codes.

To mitigate this issue, we just have to make sure that the exit code of the last command in the Command Line runner (or a build script) is 0. For instance, by executing an exit 0 command in the build step (or in the Makefile). In this case, it will be possible to mute the failures and make the build configuration succeed. If the exit code is 0 but there are still test failures that are not muted, then TeamCity knows that it has to fail the build.

Summary

Support for Go is provided by TeamCity out of the box, there are no external plugins required. TeamCity parses results of go test command execution. The results are persisted and it is possible to review the figures in a historical perspective. Consequently, all the TeamCity features that are related to test reporting are now available for Go developers.

banner_blog@2x

Getting Started with TeamCity TestDrive

$
0
0

TeamCity is mostly known as an on-premises CI server. But if you want to get a taste of TeamCity, you don’t really need to install it on your servers. Enter TestDrive!

TestDrive is a limited cloud TeamCity offering. It is a way to try TeamCity for 60 days, without the need to download and install it. TestDrive is currently hosted on top of the teamcity.jetbrains.com server and lets you create one TeamCity project.

This blog post is a getting started guide on how to set up a project in TestDrive.

Logging in

On the TeamCity download page, select the TestDrive tab and click “Test Drive in Cloud” button.

01-testdrive-get-teamcity

You will proceed to the login screen of the hosted TeamCity instance. It is possible to register a JetBrains account or log in with any other account that is supported in TestDrive: Google, GitHub, Yahoo!, or Atlassian BitBucket. For instance, if the repository that you are planning to work with is located at GitHub, then it makes sense to log in with a GitHub account.

Creating a project

After the login, the setup wizard will offer a number of options to configure your project. Say, we logged in using a GitHub account. Now the connection with GitHub is created and TeamCity can list all the repositories available on the account. We can just select the repository, and TeamCity will create the project and an initial build configuration.

03-testdrive-new-project-from-github

04-testdrive-new-build-configuration

In this example, we have selected to build a fork of the Go Buffalo framework. In one of the previous blog posts, we already described how to build Go projects with TeamCity. Let’s use that knowledge in this new context.

TeamCity will scan the repository and detect the possible build steps. The steps are backed by the build runners. If TeamCity locates any relevant files that are related to the runner, it will offer to configure a corresponding build step. Such file examples include IDE project files, Dockerfile, pom.xml, gradle.build, shell scripts, etc.

05-testdrive-build-steps

For Buffalo, we only need a Command Line build step to execute the go command.

To make sure that the build runs with the correct version of Go, it makes sense to execute the build step in a Docker container. In the build step configuration, we can specify which image should be used. In this case it’s golang:1.12.

06-testdrive-command-line-build-step

Don’t forget to configure the Golang build feature:

07-testdrive-golang-build-feature

The build is ready to start. We can either start it manually or configure a build trigger to react to the new changes in the repository.

Running the build

To run the build, click the Run… button on the top-right of the screen. The build job will be placed in a queue. While it is waiting, we can see which agents are available to execute the build.

09-testdrive-in-build-queue

10-testdrive-running-build

Once a build agent becomes available, the build will start and its status will be updated in real time while it is running. I there are any test failures, the status will indicate the failure long before the build finishes. You can monitor the build progress on the Build Log tab:

11-testdrive-build-logs-2

Once the execution has finished, we can see the test results and analyze any failures. In our example, a few tests have failed and we can check what the reason was, assign an investigation, or even mute the failures.

12-testdrive-build-results

13-testdrive-build-results-test-failure

Invite friends to collaborate

Once we have configured the project in TestDrive, it is listed under the account that we used for sign in. We can invite more people to work on that project. To do this, go to the Invitations tab in project settings and create an invitation link.

The invitation includes the correct role that will be assigned to the collaborator when they join the project by using the generated link. In this way, we can create multiple invitations for different roles.

14-testdrive-invite-collaborator

14-testdrive-invite-collaborator-url

Screen Shot 2017-10-25 at 13.22.35

Build Chains: TeamCity’s Blend of Pipelines. Part 1 – Getting Started

$
0
0

In TeamCity, when we need to build something, we create a build configuration. A build configuration consists of the build steps and is executed in one run on the build agent. You can define as many build steps as you like in one build configuration. However, if the number of steps grows too large, it makes sense to examine what the build configuration is doing – maybe it does too many things!

We can split the steps into multiple build configurations and use TeamCity snapshot dependencies to link the configurations into a build chain. The way TeamCity works with build chains enables quite a few interesting features, including parallel execution of the builds, re-using the build results, and synchronization for multiple source control repositories. But most of all, it makes the overall maintenance significantly easier.

In this blog post, we will explain how to create a build chain in TeamCity by configuring the snapshot dependencies for the build configurations.

The minimal build chain

To create a simple build chain, it is enough to create two build configurations and configure a snapshot dependency from one configuration to another.

For this example, we are using a GitHub repository. The repository includes a Gradle project that builds a Spring Boot application. In addition, there is a Dockerfile for building a Docker image.

We are going to build this project in two steps. First, we will build the application, and then build the Docker image with the binary produced in the first step.

01-tc-pipelines-todo-backend

First the build configuration, TodoApp, builds the Spring Boot application and publishes an artifact as a result. The second build configuration, TodoImage, depends on the TodoApp build configuration and builds a Docker image.

02-tc-pipelines-todoapp-config

There are two kinds of dependencies that we will need to configure: the snapshot dependency and the artifact dependency.

03-tc-pipelines-todoimg-dependencies

Artifact dependency

The TodoApp build configuration publishes an artifact to the todo.jar file. Any other build configuration can download the file by configuring the corresponding artifact dependency.

On the Dependencies tab, click the “Add new artifact dependency” button. In the dialog, locate the build configuration from which the files should be downloaded and specify the patterns to match the file path(s).

05-tc-pipelines-todo-backend-artifact-dep

The documentation page describes how to configure the artifact rules in more detail.

Snapshot dependency

To configure a snapshot dependency, go to the Dependencies tab in the build configuration settings and click the “Add new snapshot dependency” button. In the dialog, locate the build configuration it will depend on and click Save.

04-tc-pipelines-todoimg-snapshot-dep

There are a number of settings associated with the snapshot dependency. You can read about the various settings in the documentation. For our current example, the default configuration is sufficient.

When the TodoImage build configuration is triggered, TeamCity makes sure all the dependencies for this build configuration are up to date. Consequently, all the dependent build configurations that form a build chain via the snapshot dependencies will be added to a build queue. The result is visible on the Build Chains tab of the project:

06-tc-pipelines-todo-backend-build-chain

Triggering the build chain

There are various kinds of triggers that are possible to set up for a build configuration in TeamCity. The VCS trigger is the one that reacts to the changes in a version control system.

11-tc-pipelines-todo-backend-vcs-trigger

In our example, there are two build configurations but we will only need one VCS trigger. This is because it’s possible to tell the trigger to monitor for the changes in the dependencies. In the configuration dialog, we have to enable “Trigger a build on changes in snapshot dependencies” checkbox.

We can configure a dedicated VCS trigger for each and every build configuration in the chain. However, each trigger creates some overhead: the server has to allocate some cycles to maintain the trigger. Additionally, it’s easier to make changes to the settings if you only have one trigger to configure. Hence, we can just add a single VCS trigger to the very last configuration in the build chain and it will do the job.

Re-using the results

The build chain completed successfully. We can start the build again. However, this time TeamCity will be smarter and skip running the builds for the dependencies where it detects no source changes.

For instance, on the first run, the build number for both our build configurations is 1. Now let’s try running the TodoImage build configuration a couple of times. Since there are no changes to TodoApp’s sources its build is not started and TeamCity re-uses the result of the 1st build. The TodoImage build number is now 3 since it was our intent to execute it.

07-tc-pipelines-todo-backend-build-chain-2

It is also possible to enforce building the dependencies even if there are no source changes. For this, click on the ellipsis next to the Run button of the build configuration. From the dialog, choose the Dependencies tab, and select the dependencies that are required to run.

08-tc-pipelines-todo-backend-enforce-dependcies

Configuring checkout rules

The current setup of our build chain doesn’t really provide us with much value yet. All the sources are located in the same GitHub repository, hence if we configure the trigger to fire on code changes both build configurations will run.

For instance, if we make a change to the Dockerfile we don’t need to run the build for the application. However, with the current setup, TeamCity detects that there’s a change in source control repository for TodoApp as well and both build configurations will execute incrementing the build numbers.

09-tc-pipelines-todo-backend-dockerfile-change

Instead, it would be nice to run the build only when necessary.

In this example, we would like to build TodoApp if there is a change to anything but the Dockerfile. And we only want to build a new image if just the Dockerfile changes – there’s no need to build the application in this case.

It is possible to configure the checkout rules for the VCS root accordingly. The checkout rules affect the actual checkout of the sources on the agent. That said, if we exclude any folders of the repository using the filters in checkout rules, those folders won’t end up in the workspace.

We will exclude the docker/ folder from the checkout in the TodoApp build configuration. And we will only pull the docker/ folder in the TodoImage build configuration, and ignore everything else.

10-tc-pipelines-todo-backend-chckout-rules-docker

Now, if we only change the Dockerfile, only TodoImage should execute and re-use the results from the previous TodoApp run without executing it.

Summary

The concept of snapshot dependencies is essential for configuring the build pipelines, aka build chains in TeamCity. The feature allows implementing incremental builds by re-using the results of the previous executions, thus saving a lot of time. In this article, we have also learned about triggering and VCS root checkout rules – both very useful for working with build chains.

Next, we will look at what else is possible with the features we have described – running the builds in parallel and also how to build projects from multiple source repositories.


Build Chains: TeamCity’s Blend of Pipelines. Part 2 – Running Builds in Parallel

$
0
0

In the previous blog post, we learned about snapshot dependencies and how they can be applied to create build chains in TeamCity. In this blog post, we describe how snapshot dependencies enable parallel builds.

More snapshot dependencies

Previously, we started creating the build chain for the demo application. We created two build configurations: one builds the application and the other builds the Docker image. What about tests?

Suppose there are a lot of tests and running those tests sequentially takes a lot of time. It would be nice to execute the groups of tests in parallel. We can create two build configurations, Test1 and Test2, which will execute the different groups of the tests. Both Test1 and Test2 have a snapshot dependency on TodoImage build configuration.

12-tc-pipelines-todo-tests

Since Test1 and Test2 do not depend on each other, TeamCity can execute these build configurations in parallel if there are build agents available.

Now the new aspect of snapshot dependencies is revealed. Using the snapshot dependencies, we created a build chain which is actually a DAG – Directed Acyclic Graph. The independent branches of the graph can be processed in parallel given that there are enough processing resources, i.e. build agents.

This leads us to the next question: how can we trigger such a build chain? Previously, we added the trigger to TodoImage as it was the last build configuration in the chain. Now there are two build configurations. Should we add two triggers – one to Test1 and the other to Test2? While it is certainly an option, there is a more idiomatic way to do that – with the Composite type of build configuration.

Composite build configuration

The purpose of the composite build configuration is to aggregate results from several other builds combined by snapshot dependencies, and present them in a single place. One very interesting property of this kind of build configuration is that it does not occupy a build agent during the execution.

In our example, we can create a composite build configuration that depends on Test1 and Test2 via a snapshot dependency. The new configuration will be the last one in the build chain. Now it’s possible to add a VCS trigger to that build configuration. As a result, there will be just one VCS trigger for the whole build chain.

14-tc-pipelines-concurrent-tests-annotated

Notice on the screenshot above that the two build configurations, Test1 and Test2, are running in parallel. The TestReport build configuration is also running, but it doesn’t occupy the build agent and will be marked as finished as soon as all the builds complete.

The nice feature of the composite build configuration is that it also aggregates the test results from the dependencies. In our example, if we navigate to the Tests tab of the TestReport build configuration, we will observe the list of tests that were executed in all the previous build configurations that belong to the same build chain.

14-tc-pipelines-concurrent-tests-composite

Summary

At first sight, snapshot dependency looks like a simple concept. However, it enables a lot of features in TeamCity. In the previous blog post, we saw how we can re-use the results of the builds to save build time and resources. In this blog post, we have learned that snapshot dependencies also enable better use of resources when builds are executed in parallel. Next, we will learn about building more complex projects that span multiple source control repositories, still applying the simple yet powerful concept of snapshot dependencies.

If you are interested in trying out the demo project on your local TeamCity instance, we have uploaded the configuration to a GitHub repository. The .teamcity/ directory contains Kotlin DSL settings for the build chain that we have described in this blog post. To import these settings, create a project from repository URL. TeamCity will detect .teamcity/ directory in the repository and will suggest creating the project using these settings.

TeamCity UI: how do we test it

$
0
0

teamcity-frontend-preview

Developing a working piece of software is difficult. Just like building an airplane, it requires talented people, working components, and a testing framework. No plane leaves the hangar before everything is ready, checked and double-checked.

In JetBrains, we adopt the same philosophy for building our software. Vigorous testing helps us discover bugs and problems before the final product takes off. Just like building a plane, software development is a process that consists of multiple stages. Although the authors of this post are not aerospace engineers, we will use simplified aircraft analogies. There are several reasons for that: aircraft is beautiful, it is pure engineering, and it reveals that the problems we raise here are not exclusive to software engineering.

The bigger your product, the more steps and modules there are. To make sure your software is ready to lift off, every module needs to be tested and correctly integrated with everything else. CI/CD services, if set up correctly, help automate this process. Most importantly, they remove the human factor famous for one careless action being able to lead to total disaster.

Contrary to popular belief, testing is very important in front-end development. To continue the analogy, your plane is not only required to fly – it has to be comfortable inside! Moreover, its exterior affects how airplane flights (aerodynamics). Getting back to the front end, this means that you have to test the usability as well as functionality. This makes front-end testing a must. In this article, we will provide an overview of UI testing used in TeamCity. If you have any questions about the technical details – don’t hesitate to ask us.


Note:

Each section of this post contains links to useful resources. Some of them lead to public TeamCity configurations where you could examine how we test the front end. Feel free to sign in as a guest and look around.

TL;DR theses:

  • UI testing is not only about the Unit tests. There are screenshots, behavior, accessibility, performance, security, and perception tests. Each of them is listed below.
  • Testing Systems and CI/CD help concentrate on things that really matter.
  • With the TeamCity, you can build sophisticated pipelines to test any UI issue.

Interception of issues

Let’s consider the interception of issues. In JetBrains, it works on multiple levels, and most of them are based on the CI/CD. Each test, each department, each level takes its part in the entire process of revealing and reporting problems. Here is a chart, where the Y-axis represents the number of issues the App could possibly have. Blue bars – the actual amount of issues. On the X-axis are presented the filters, which take care of issues. So it depicts, how different layers impact on the actual amount of issues.

teamcity-frontend-issue-interception-barchart

Every filter takes care of some issue categories.

For example, a huge amount of UI problems we catch belong to the Screenshot testing stage. Fewer problems belong to the Linters / Unit / Render tests. That doesn’t make those tests meaningless. On the contrary, it could mean that we work in these areas well enough to prevent tons of issues.

The key point we would like to show here: as you can see, the Quality Assurance Department faces only one-third of the problems. This means that by using CI/CD you could help your colleagues to save time on inspecting issues that are easy to predict, which could be caught by a well-organized testing system.

The chart isn’t 100% representative and numbers float from release to release: some level can remove more problems than others. However, it shows that the test system is very important, even if a separate test covers only one case. Quantity doesn’t equal quality here: a test could find “only” one bug but that one bug could’ve crashed your whole application if left unnoticed.

Linters, typings, unit tests

Firstly, we ought to say that the code should be clean and consistent, but there’s an issue with that. Everyone has their own understanding of clean code. In JetBrains, we agreed on 200+ rules that make sure our code stays objectively clean. As a result, we get a warning from IntelliJ Idea whenever a linter detects a problem. It’s not superfluous to mention that static typings with TypeScript, Flow, Kotlin, or Reason are required for complicated applications. We, the TeamCity team, have decided to use Flow. One of the first tests we use for building the front end is just eslint/stylelint check. Its purpose not only to find code style problems but also issues with missed variables, imports, or non-cheap/safe operations (like React Hooks without dependencies).

Of course, there are also unit tests. It’s simple: we write pure atomic functions and then assert their output. If the output is OK, TeamCity marks them green and allows the pipeline to continue.

Read more:
Unit Tests / Linter build configuration settings
JestJS – a framework to organize unit tests

Screenshot testing

Displaying consistent UI across multiple devices and platforms is one of our main goals. We need to be certain that all the components are displayed correctly, regardless of the used browser, layout, or viewport size. This implies testing how the components are visually presented in different configurations. Screenshot testing does exactly that.

teamcity-frontend-screenshot-assertion-2

Screenshots diff

After one of the updates Comment sections have been added to the Unauthorized Agents. That’s quite ok. But imagine, that this kind of test could reveal the disappearing of elements. It happens from time to time and we find this test very useful. Although, Snapshot Testing, you’ll get familiar soon also will help in this case.

That’s how we do it:

  1. Launch a server that renders the components (Storybook in our case).
  2. Connect to the server using the WebDriver API; this API allows us to interact with a website in an automatic mode – without a real user.
  3. WebDriver calls the relevant components.
  4. Hermione, a utility tool by Yandex, connects to Storybook using WebDriver and takes multiple screenshots of the selected area in every browser.
  5. Those screenshots are then put into a folder, where Hermione compares them to the default screenshots using Mocha.
  6. If something has changed, we get a notification. The differences are also visually highlighted!

Read more:
Ring UI Hermione build configuration settings
Screenshot false assertion example

React and rendering

We try to improve the performance of our interfaces by minimizing the amount of unnecessary rendering. Generally, React is pretty good at that. However, there are some cases you should keep in mind: if you change something in a component, React creates a new one instead of modifying the original component.

Imagine that you pass new props into a component. In order to save the resources needed for a re-render, React checks if the passed props differ from the previous version. If they are the same, no re-rendering takes place. Unfortunately, many of us forget that in JavaScript two arrays or objects with equal content are different entities (because those objects/arrays will have different references). As a result, we end up unnecessarily rendering equal components.

why-did-you-render

React Highlights DOM Updates

You can enable React Updates Highlighting with React Developer tools. This will reveal all re-renders in your App. For example, there are rerenders, which take place during cursor moving over the Trends Page subcomponent. Fortunately, all those rerenders are intended here. But imagine, that adding to these re-renders app will fire one hundred more?

Read more:
React Lifecycle diagram

Should we re-render?

We already know about the danger. Nevertheless, we decided to check for redundant rendering using why-did-you-render. To our surprise, we discovered multiple instances of inefficiency. That’s how we did it:

  1. We created a dummy action: it triggers changes to the store.
  2. If we change something in the store, we will make all the components (subscribed to this store) collect data once again. It happens with mapStateToProps callback.
  3. After collecting the data, we pass it to the component and launch compare function to check, whether the props had been changed or not.
  4. Meanwhile, we know that the dummy action doesn’t actually change any values in the store, meaning that no new props should be passed to the component.
  5. If new props lead the component to a re-render, we know that we created a new object/array somewhere where we should not. What a shame!

teamcity-frontend-why-did-you-render-test-assertion

TeamCity reports excess re-renders

We have two tips for solving this problem:

  • The reselect library
  • Immutable data structures

Reselect library

Using the reselect library, you can memoize results if all the parameters for the generation function remain the same. If the passed parameters are equal to the previous ones, we will receive not the new objects, but the references to old ones. No re-rendering takes place.

Immutable data structures

You can predefine an object or array as immutable by freezing it. Next time, whenever you would like to return a fallback value, you should return this immutable object. It guarantees that reference to this object always will be the same, so the component will not be re-rendered.

Snapshot testing

Snapshot testing verifies that any changes made to the structure of important components are intentional. Once again, let’s return to our airplane analogy. Imagine that we have a snapshot of a plane’s structure: it should have a body, one wing, and four jet engines. Suddenly, we decide to remove one of the jet engines and replace it with a turbine. While this may be a great idea, it no longer fits our snapshot. Consequently, we would get a notification.

An IL-76 with 3 Jet Engine and 1 Fan engine

Sometimes even hardcoded items could be changed. Photo by Anthony Noble

In the picture above the change was intentional, with obvious ramifications. Now imagine a snapshot of our plane which consists of hundreds of components: tracking all the interactions would be very difficult. JavaScript projects are similar in this respect. A small change to one component could lead to unwanted consequences for the structure of the whole project.

You can protect structures by creating their snapshots. Whenever you misprint, change an HTML class, or add a new component, you will break the structure. A snapshot test will notify you if you do. Check the example below:

  1. We create a snapshot of an important structure. We specify the IL-76LL engines:
    teamcity-frontend-snapshot-testing-1
  2. We always want to compare future airplanes to the snapshot we made previously.
    teamcity-frontend-snapshot-testing-2
  3. Here, we change the engine type from turbofan to turboprop. Just to test how it works. Since the new engine no longer matches our snapshot, the test fails. We’ve got a report, and our engineers are on their way to investigate the problem.

teamcity-frontend-snapshot-testing-turboprop

The same to the React components:
teamcity-frontend-snapshot-testing-3

Read more:
Storybook Structural Testing / Jest Snapshot testing guide

E2E Tests

E2E tests are very similar to test flights. Like with planes, we have to make sure that our interface is actually usable in the real world. With thousands of components interacting with each other, you never know if your plane can take off before the pilot actually takes it into the air.

E2E tests are designed to test an application flow from start to finish. Those tests emulate a real user who is going through the same specific use case over and over again.

e2e

E2E in action

This is how E2E testing looks in our case:

  1. Create a list of scenarios that are critical from the user’s POV (user stories).
  2. Create an automated test for every listed scenario.
  3. Each of those tests should describe how Selenium is supposed to interact with the UI.
    1. Imperatively:
      1. Open the browser.
      2. Login.
      3. Go to page X.
      4. Press button Y.
      5. Make sure window Z is displayed.
    2. Declaratively:
      1. “Make sure the user gets the window Z after going to page X and start process Y.”
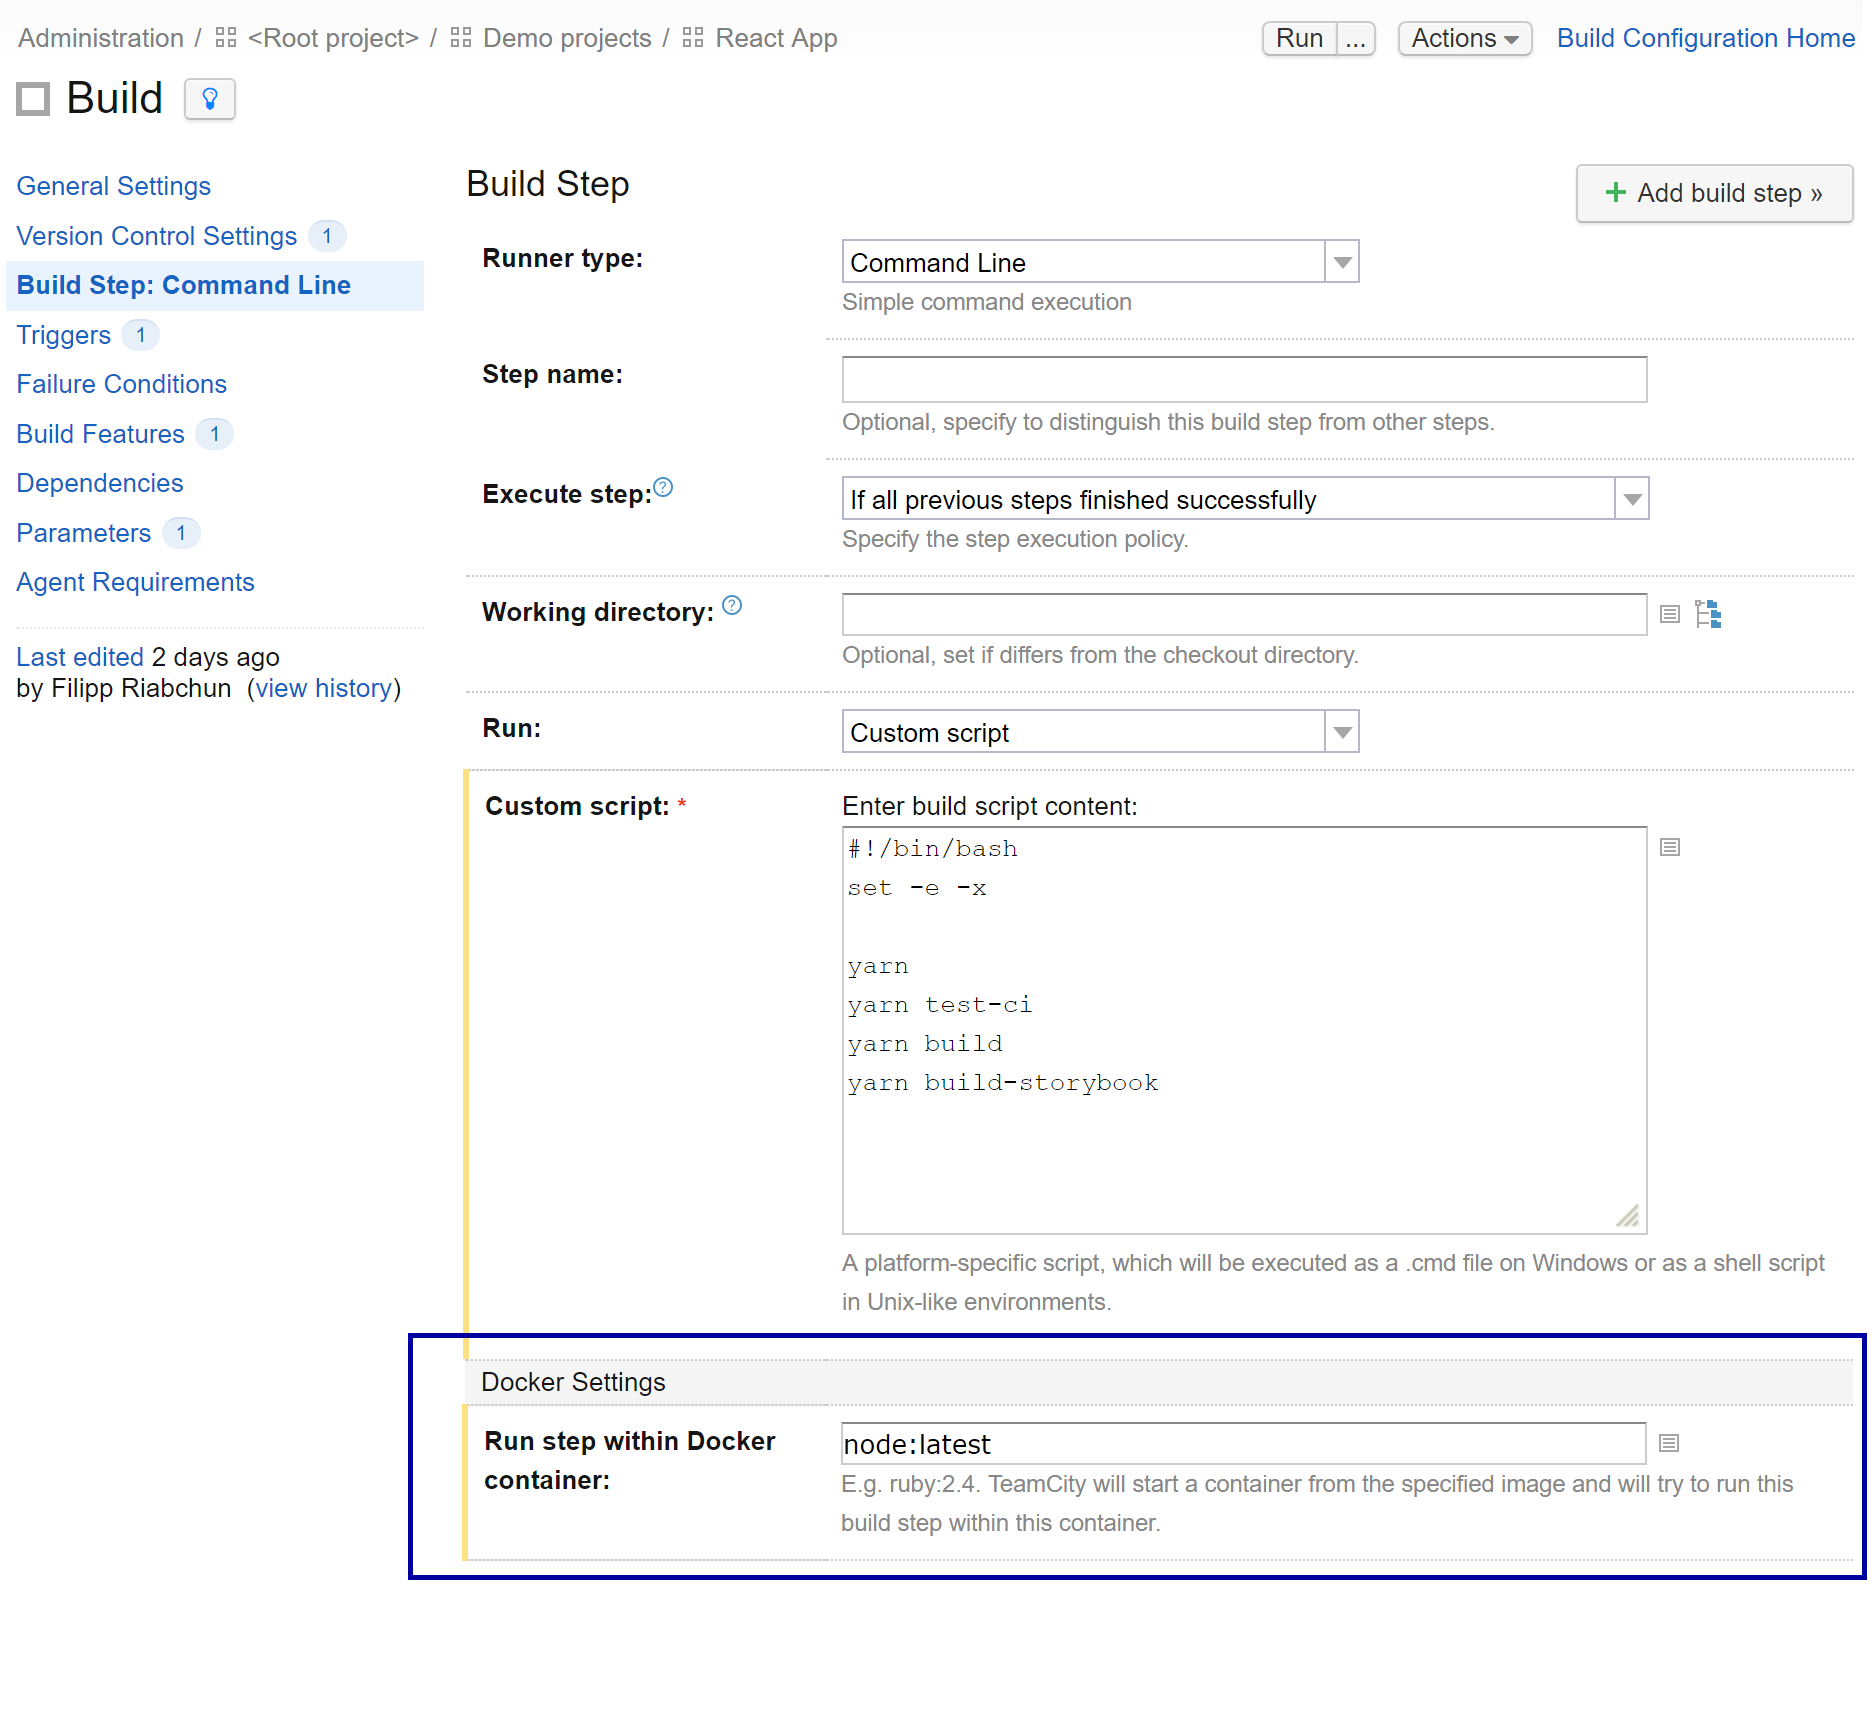
  4. Launch the Docker container with the last TeamCity instance.
  5. Launch the tests; those tests connect to Docker using Selenium and execute the algorithms.

Read more:
E2E build configuration settings

Other tests

Writing this article took a while. During this time we had implemented some new tests, such as Dependencies Security Audit, Accessibility tests, and we are also discussing some new categories of tests. We are looking forward to your feedback to continue writing articles and dive deeper into the front-end testing area.

TeamCity and build chains

TeamCity lets you create infinitely complex logic for launching tests and deploying builds. This is how TeamCity displays the chain/timeline of builds for its own UI.

teamcity-frontend-pipeline

As you can see, TeamCity runs tests in parallel, and in consequence, some builds waiting for others to been finished successfully. And if something goes wrong, it could stop the whole pipeline – just to prevent wasting resources on the tests which will definitely fail.

And this is how TeamCity visualizes a huge project like itself:

teamcity-frontend-buildchain-overview

The important point here is that we could not only build complex pipelines but make them sophisticated, complicated in a good manner. For example, some parts of our pipeline must be built on OS X agents, some of them – on the Linux system, and some of them are going to be built with Amazon Cloud Agents.

Read more:
Build Chains: TeamCity’s Blend of Pipelines (part 1)
Build Chains: TeamCity’s Blend of Pipelines (part 2)
Ring UI build chain

Conclusion

Do you remember the first diagram? Our automated tests cover more than half of those issues, and the Quality Assurance Department covers one-third part. Nevertheless, there is always something left. In JetBrains, we widely practice “dogfooding”: we use our own products (IntelliJ, TeamCity, Space, YouTrack, and so on) to develop and build software. So, at this stage, everyone inside JetBrains could come to us and share feedback. By doing so, we get notice and fix bugs that passed all the other filters.

teamcity-frontend-issue-interception-barchart

During our Early Access Program, you can find out more about the new features we are making right now, share your feedback, report issues, and ask us to include some new features so they are released as soon as possible.

Hopefully, we’ve made the basic principles of front-end testing clear. Summing up, you can consider it insurance: it requires some effort but can be lifesaving. To get the most profit from CI/CD for small-scale projects, you can use TeamCity free of charge. Protect yourself from costly mistakes!

To try TeamCity right now, follow this link.

With love,
TeamCity Team

Build React Apps with TeamCity

$
0
0

Greetings, everyone!

In this blog post we will talk about building a React application with TeamCity using one of the newest TeamCity features –  Docker integration, introduced in  TeamCity 2017.2 EAP1. (At the moment the TeamCity-Docker support can run on Mac/Linux build agents).

We’ve created an example on GitHub based on Create React App and Storybook, and set up a demo project on the public TeamCity server with the VCS Root pointing to the project on GitHub.

We used the Command Line build step for our build configuration.

Command Line Build Step

We are going to execute the following script:

#!/bin/bash
set -e -x

yarn
yarn test-ci
yarn build
yarn build-storybook

Here yarn is used for installing dependencies and running scripts, but it is possible to use npm as well.

Our command line will run in a docker container – in TeamCity 2017.2 EAP the Command Line runner settings have the Docker settings section where you can specify the image for the container:

TeamCity will start the container and run this build step in it. node:latest in the Docker settings section stands for Docker’s official node image):
buildStep

Report tabs

test-ci in our script runs tests with the jest-teamcity-reporter plugin (see this commit).
In the line react-scripts test --env=jsdom --coverage --testResultsProcessor=jest-teamcity-reporter, the --coverage option turns on generating a code coverage report, which will be displayed in a dedicated build tab. TeamCity has the report tabs feature, and on our server the Root project – the parent of the demo project – has a predefined Code Coverage tab which expects the report to be at coverage.zip!index.html:
rootCodeCoverage

All we have to is specify the artifact path coverage/lcov-report => coverage.zip in the General Settings section of our build configuration:
artPaths
We also added the artifact path for the build directory (build => build), so that it is available in the artifacts and can be deployed to some server later, which is out of scope for this post.

After running the build, the Code Coverage report is available on the build results page.
Screen Shot 2017-08-23 at 04.22.29

In our build the build-storybook script generates a living style guide for your component base using Storybook. It will be handy to use another build tab to display it, so the storybook-static => stories artifact path has been added. Then we set up a custom tab in the “React App” project settings using the Report tabs section:
reportTab

Note that this Stories tab available on the build results page is generated per build, so you can see how your components change over time and, for example, detect at which point something started looking and/or behaving in a strange way.
Screen Shot 2017-08-23 at 04.17.55

Your feedback is always welcome in our forum and tracker!

Happy building!

banner_blog@2x

Introducing TeamCity RunAs Plugin

$
0
0

When building, testing, and deploying an application with TeamCity, you may need to run a build under a specific user account, different from the one used to run the build agent.

TeamCity RunAs Plugin Overview

The teamcity-runas plugin can be used to run TeamCity build steps under a specified user account on Windows or Linux.

The plugin is compatible with TeamCity 10.0 and later.

Installing Plugin

System Administrators can download the runAs.zip from here and install it on the TeamCity server as usual.

Configuring TeamCity Agents

On Windows

The teamcity-runas plugin requires the TeamCity agent’s account to have certain permissions. Depending on the way you run the agent, granting additional privileges may be required.

  • If you are running the TeamCity agent as a Windows service under the Local System account, it has all required permissions and the teamcity-runas plugin works out-of-the-box.
  • If you are starting the agent as a Windows service using a specified Windows account (for example AgentUser), it must have administrative privileges, must have the ability to replace a process level token (SeAssignPrimaryTokenPrivilege), and act as a part of the operating system (SeTcbPrivilege) or needs to work under the Local Service account. These privileges can be added via a security policy using Control Panel | Administrative Tools | Local Security Policy | Local Policies | User Rights Assignment | Replace a process level token. See Microsoft documentation for details.
    You can also do it using the provided scripts, e.g.: runGrantAccess.cmd BuildUser.
    The changes will not take effect until the next login, so you’ll have to restart the agent.
  • If you are starting the TeamCity agent as a Windows console application, your Windows user account must have administrative privileges.

On Linux

  • With Debian/Ubuntu/Linux, the recommended setup is to run the TeamCity agent as ROOT, as in this case the account has all the required privileges and the teamcity-runas plugin works out-of-the-box (see the related section below).
  • If you run the TeamCity agent as a user different from ROOT, you need to install socat using the following command:
    sudo apt-get update && sudo apt-get install socat

Using Plugin

After the server restart, the plugin provides the Run As build feature and you can add it to your build configuration specifying the username and password.

For Windows the following username formats are acceptable:〈username〉or〈username@domain〉or〈domain\username〉.

For Windows-based build agents it is possible to specify the Windows Integrity Level, the logging level, and additional arguments.

runAS

Once the build is run, the plugin will run all the commands under the specified user account.

Checking Account Used to Run Build

You can enable the teamcity.runAs.log.enabled= true parameter of a build configuration (set to “false” by default) and TeamCity will print the required information into the build log.

runASvalidCreds

If the credentials are invalid, the build fails with “Authentication failure” error:

runASinvalidCreds

Alternatively, to make sure the teamcity-runas plugin is configured properly, you can get the user whose account was used to run the build by checking the environment variables: USERNAME (for Windows) / USER, LOGNAME (for Linux).

For example, you can add a command line build step with the set USERNAME command on Windows / echo "$USER" echo “$LOGNAME” on Linux. This will print the user whose account was used to run the build into the log.

Accessing Files created by RunAs User

It is important to note that when running a build under a specified user account, all processes run in the environment specific for this user.

It means that all files created during the build (e.g. compiled classes, object files, executables, dlls, Gradle/Maven cache files, TeamCity artifacts, some test statistics and so on) will have the teamcity-runas user as the file owner.

The TeamCity agent must have the full control over the files created in the build checkout directory and ideally, over files in other locations, e.g. m2 or .gradle directories as well. Depending on the way you configured the agent (see Configuring TeamCity Agents above), the access level will differ and granting additional permissions may be required.

For Windows, the account with administrative permissions used to run the TeamCity build agent will have sufficient rights to manage the files.

For Linux, if the TeamCity agent is not running under ROOT, it may encounter problems accessing artifacts in the build checkout directory. In this case the necessary permissions can be granted by running the following command:
chmod -R a+rwX %teamcity.build.checkoutDir%.
It can be added as the last step of the build executed under the ‘Run As’ user.

Install the plugin on your TeamCity server, give it a try, and let us know what you think about it.

Happy building!

The TeamCity Team

TeamCity Plugin for HashiCorp Vault

$
0
0

When performing integration tests and deployments, build scripts need credentials to access external servers and services. Traditionally passwords are stored on the TeamCity server as secure parameters. But although secrets are masked in the UI, encrypted at rest, and protected from being exposed in the build log as plain text, this often does not provide a high enough level of security.

HashiCorp Vault offers a unified approach to managing secrets and credentials, allows auditing access, and helps with password rotation.

Integration with Vault

Today we are presenting a new plugin to help build scripts interact with Vault and obtain credentials dynamically.

The plugin allows connecting TeamCity to Vault, requesting new credentials when a build starts, passing them to the build script, and revoking them immediately when the build finishes.

Usage

We expect you have installed and configured:

  • a Vault server. Refer to the Getting Started guide to learn how to launch a testing Vault instance.
  • A TeamCity server. Refer to the Getting Started guide for details.

Perform the following:

  • Download the plugin from the plugin repository, and install it to TeamCity server.
  • Configure secret backends in Vault to obtain secrets, for example AWS credentials, or generic secrets.
  • Create an AppRole in Vault for the TeamCity server to access these backends.
  • Create a connection to Vault in your TeamCity project:1
  • Next, in your build configuration declare new build parameters which refer to the Vault secrets to be used in this build:

screenshot_17334

The parameter value has a special syntax:%vault:PATH!KEY%where PATH is the secret name, and KEY is the specific value inside.
At the moment these values can be used in the build parameter declaration only, and cannot be specified in build steps.

  • Run a build step. Deployment scripts can read credentials from environment variables, and do not need to perform any Vault-related actions:3

Besides AWS, any other Vault backends can be used. In this case:

  • Declare a configuration parameter with a value from generic backend:4
  • In a build step refer to this  parameter explicitly:5

How It Works

  • The TeamCity server stores the AppRole ID and secret, and keeps the secret encrypted at rest. When required, it can be rotated manually in the UI, or via the REST API.
  • When a new build is started, the TeamCity server requests a one-time response wrappingtoken in Vault, and sends it to a build agent.
    The AppRole secret never leaves the TeamCity server machine.
  • The build agent requests the actual secrets from Vault.
    The actual credentials are obtained from Vault by a build agent machine directly, and never transferred to the TeamCity server.
  • The build parameters are resolved and the secrets are passed to environment variables and system properties.
  • The build steps are started, and they refer to these environment variables and system properties.
  • If secret values appear in a build log, they are automatically replaced by asterisks.
  • Right after the build finish, the credentials are explicitly revoked in Vault.

Security Considerations

It is advised that you limit access to TeamCity project settings. If a person can modify build configuration settings in a TeamCity project, they can get access to the secrets. Dynamic credentials are revoked after a build, but for generic secrets this may cause more risks. To minimize the risks, split build configurations for CI and deployments into separate projects with different permissions.

Make sure build agent machines are connected to the TeamCity server via HTTPS. Only one-time tokens are transferred over network, and if they are stolen, credentials will be immediately revoked. However, it is a good practice to encrypt all traffic between the server and agents.

Feedback Wanted

This is an initial release, and we continue to improve features and user experience, and encourage you to give it a try and tell us what do you think!

The plugin is open-sourced, and published on GitHub.

If you are attending HashiConf in Austin, TX, USA next week, visit the JetBrains sponsor booth for the demonstration of this plugin and our other plugins for integrating Packer and Terraform with TeamCity and IntelliJ-based IDEs.

Viewing all 103 articles
Browse latest View live


<script src="https://jsc.adskeeper.com/r/s/rssing.com.1596347.js" async> </script>