Quantcast
Channel: How-To’s : TeamCity | The JetBrains Blog
Viewing all 103 articles
Browse latest View live

TeamCity: Beyond Continuous Integration, June 26th Webinar

$
0
0

Join us Thursday, June 26th, 15:00 – 16:00 GMT (11:00 AM – 12:00 PM EDT) for our free webinar, TeamCity: Beyond Continuous Integration with Wes McClure.

Continuous Integration is a gateway to further automation. It lays a foundation to change software quickly, with confidence. But why stop there? As we experiment with automation, we can establish techniques to further test, distribute and deliver software. Can you imagine what it would be like to focus on adding valuable features without being burdened with how they’re released to the world?

Come experiment with us as we explore the landscape of opportunities beyond Continuous Integration. See how build chains and dependencies provide a robust framework to orchestrate the benefits automation can bring, to the software you create.

Space is limited, please register now. There will be an opportunity to ask questions during the webinar.

About the Presenter:

Wes McClureWes McClure is passionate about helping companies achieve remarkable results with technology and software. He’s had extensive experience developing software and working with teams to improve how software is developed to meet business objectives. Wes launched Full City Tech to leverage his expertise to help companies rapidly deliver high quality software to delight customers. He has a strong background in using Continuous Integration with TeamCity to bring quality to the table.

TeamCity: Beyond Continuous Integration, Webinar Recording

$
0
0

The recording of our June 26th webinar with Wes McClure, TeamCity: Beyond Continuous Integration, is now available on JetBrains YouTube Channel.

In this webinar, we explore the landscape of opportunities beyond Continuous Integration. See how build chains and dependencies provide a robust framework to orchestrate the benefits automation can bring, to the software you create.

The prior webinar mentioned in the recording is Getting Started with TeamCity. Wes’s slides are available on SlideShare.

Below are select questions and answers from our webinar.

Q: I have my TC 8.1.2 but I cannot find the build chain pane. Where is it?
A: You’ll see build chain tab once you run a build with snapshot dependencies.

Q: If another project A causes a test in Project B to fail, but project A itself is fine, then we will not know what causes the test to fail. Is there a way to change the build number of the test in Project B to reflect that this test was triggered by project A?
A: If project B depends on project A somehow (by snapshot or artifact dependency), you can include build number of project A in build number of project B.

Q: I’m using maven to build my Java application. Can I parse maven project version from the pom.xml and combine with the %build_counter% to form my artefact version?
A: Yes, you can. You can use %maven.project.version% parameter in build number.

Q: You mentioned triggers: Where in this chain would you put your trigger?
A: In this particular example, you should place trigger in Deploy QA configuration.

Q: Why is “pull” triggering better than “push” triggering?
A: In case of “pull” triggering TeamCity has a chance to reuse builds. Say you start Deploy QA and it places all other builds in the queue. Next TeamCity checks to see if there are already finished builds from this chain that can be reused. If there are some, it will take them and will not run new builds.

Q: To tell what is in a build, is that solely in the version control system or does TeamCity provide a view of the changes?
A: TeamCity detects version control changes and shows them in the UI. With snapshot dependencies you can also configure it to show changes from dependencies. So with deploy QA you can always see what changes were included into the build from the deploy QA dependencies.

Q: Are we planning to have any signing feature, e.g. signing the release with approval?
A: You can configure TeamCity to ask for confirmation when some potentially dangerous build is being triggered

Dmitri NesterukWes McClure is passionate about helping companies achieve remarkable results with technology and software. He’s had extensive experience developing software and working with teams to improve how software is developed to meet business objectives. Wes launched Full City Tech to leverage his expertise to help companies rapidly deliver high quality software to delight customers. He has a strong background in using Continuous Integration with TeamCity to bring quality to the table.

Applied Automation TeamCity and NDepend

$
0
0

This guest blog post is from Wes McClure, Software Consultant and Founder of Full City Tech Co., a JetBrains Training and Consulting Partner. 

In Approaching Automation, I outlined a series of steps to follow to make worthwhile investments in automation. In the following example, I’ll show how to apply these steps to a software development process.

Inspecting code can provide valuable insight into improving the design of a system. Inspection tools are most valuable when they’re integrated with the environments that developers use to create software. They can provide instant feedback to improve, on the fly.

Inspection is also valuable as an analysis tool after the fact. One barrier to analysis is the time it takes to setup and inspect a code base. This process is ripe for automation so time can be spent analyzing results, not gathering them.

Wes McClure

Wes McClure, Software Consultant and Founder of Full City Tech Co.

But, blindly automating anything is as reckless as avoiding automation altogether.

Often, when discussing inspections, I find individuals wanting to inspect code bases every time a change is made to the system.

I’ll inquire how often do you perform this analysis currently and what do you do with the information? Often, I find there’s no methodical approach and sometimes inspection isn’t even a part of an existing process. It’s just something that someone said was a good idea.

Whatever the case, by stepping back and discussing how often the information is used and what it’s used for, we can begin to understand the value of automating inspections.

By challenging ourselves to understand why the information is valuable, we can determine the appropriate level of automation to improve.

Most teams are busy enough, they’ll be lucky to look at inspection results once a week. And, if they have to manually generate it, it’s much less likely they’ll even get around to it.

But, if inspection reports are automatically available on a weekly basis, they could invest more time in analyzing the results. And in turn, invest in acting on the results.

NDepend is a tool to inspect a .NET code base and provide actionable metrics to improve.

TeamCity is a platform to automate development processes, gather results and act upon them.

Let’s walk through the basis for automating inspections with NDepend and TeamCity.

Outline

First, we should outline the process.

NDepend is used to inspect a code base. This requires checking out the code, compiling it and then analyzing the results with NDepend.

Then, teams analyze the results for ways to improve.

And over time, they apply this insight to incrementally improve.

Eliminate the unnecessary

After outlining the process, it’s important to eliminate vestigial components. In the case of inspections, this is a matter of making a conscientious decision about what inspections are meaningful and what aren’t. Don’t just take everything out of the box. And, spend some time with NDepend to craft your own custom inspections.

Establish objectives

Next, it’s important to establish objectives. NDepend comes with the concept of rules. Reducing rule violations can improve the quality of a code base. For example, NDepend comes out of the box with rules that help detect breaking changes to software interfaces. It also provides rules to detect dead code which can hamper the longevity of software. Deciding on a set of rules to enforce may serve as a worthwhile objective.

Establish measures

Let’s say we want to reduce dead code in a system. Every system contains some amount of dead code. Some of it can be detected automatically. Measuring the current level of dead code in a system and setting goals to reduce it serves as a progress indicator.

Establishing value

What if your system is comprised of ten percent dead code? What would it be worth the get that to five percent? What about one percent?

Make a decision

Everything above becomes the basis with which one decides to automate, or not automate, inspections of dead code or any other aspect of a system.

I always recommend a margin of two or three times the potential cost. That way you have room to absorb the unknown.

Automate it

There’s no better way to describe automating it than to show you:

Reflect

Over time, use the information you capture in TeamCity from the output of NDepend to see if efforts prove worthwhile.

Not everything is so easily quantifiable. Nonetheless, you can start to see how you can apply a methodical process focused on value to scientifically improve your development process.

The original post was published September 11th, 2014 on www.wesmcclure.com. 

TeamCity and Visual Studio Online Source Control

$
0
0

Many teams are working with Visual Studio Online (VSO), a hosted Team Foundation Server that provides source control and issue tracking as a cloud service. While VSO comes with a build server as well, lots of developers prefer to use TeamCity for their continuous integration story because of its advanced features to automatically run builds for feature branches,  automatic merge and many others.

TeamCity supports building projects that are hosted on Visual Studio Online, the only thing we have to do is add a VCS root to our build configurations. Depending on the version control system used for the project (Git or Team Foundation Version Control – TFVC), this will be slightly different. Let’s have a look at our options.

Enabling alternate credentials

Independent from the version control system used, we will have to enable alternate credentials support on our Visual Studio Online account. Applications that work outside the browser, such as the git client or the command-line TFS client, require basic authentication credentials to work. By editing our VSO profile, we can set a secondary username that can be used for these scenarios.

After navigating to our VSO account portal, we can use the menu at the top-right to edit our profile. The Credentials tab lets us enable alternate credentials. After clicking Enable alternate credentials, we can set a secondary username and password we can use later on.

Visual Studio alternate credentials for TeamCity

After saving our changes here, we can proceed with connecting TeamCity to Visual Studio Online version control.

Connecting to Visual Studio Online Git

For teams embracing Git source control with Visual Studio Online, TeamCity setup is really easy. From the Administration section, we can create a new project from URL. Next, we can enter the URL to our VSO Git repository and provide the alternate credentials we’ve just set up. TeamCity will auto-detect we’re using a Git repository.

Create project from URL

Connecting to Visual Studio Online TFVC

Projects that are using Team Foundation Version Control (TFVC) can leverage TeamCity in their projects, too. The workflow to get started with a new project is the same: from the Administration section we can create a new project from URL, entering the URL to our Visual Studio Online project’s TFS path. This typically looks like https://accountname.visualstudio.com/DefaultCollection/$/ProjectName. For credentials, we can enter our Microsoft Account credentials, or use the alternate credentials created earlier.

Create TeamCity Project from Visual Studio Online

Note that for TeamCity versions < 8.1.5 and older versions of Team Explorer, the Microsoft Account name has to be prefixed with ##LIVE##\.

Creating the Build Configuration

Once we have connected to Visual Studio Online, TeamCity will try to identify potential build steps we can use. It will browse our repository and look for Visual Studio solution files, projects, batch files, NuGet packages that have to be restored and so on. We can use these automatic steps, or add our own to fine-tune our build process.

Auto-detectedbuild steps

When at least one build step is configured, we can start our build. It is possible to fine-tune our version control integration from the build configuration’s Version Control Settings. In here, we can configure what our branch structure looks like so that TeamCity automatically runs the build configuration for any feature branch we have. We can also modify the VCS Changes Checking interval and change when to check VSO  for changes.

Using a Trigger, a build can automatically be started when chenges are checked in to VSO. The VCS Trigger must be added to the build configuration to do this. Optionally, we can build for every single change, accumulate check-ins and so on.

Automatically start TeamCity build when changes checked in to Visual Studio Online

Many other triggers are available, such as the Schedule Trigger which starts a build at a given time. The Finish Build Trigger can start a build once another build has been finished. We can also monitor NuGet feeds and trigger a build when a given dependency changes.

TeamCity is a great companion to Visual Studio Online for many scenarios. Happy building!

Introducing TeamCity Azure plugin – Run builds in the cloud

$
0
0

Microsoft AzureIn a large TeamCity setup with many projects, it’s often very difficult to predict the load on build agents, for example during releases. One minute we need only one agent to be running, the next minute we need 50. Not to worry! TeamCity supports scaling out builds to Amazon EC2, and starting today, also Microsoft Azure!

For each queued build, TeamCity first tries to start it on one of the regular, non-cloud agents. If there are no regular agents available, TeamCity finds a virtual machine or virtual machine image with a compatible agent and starts it on Azure. TeamCity ensures that the configured maximum number of instances is never exceeded. Let’s have a look at how we can get started with a Windows or Linux build agent farm on Microsoft’s cloud platform.

Installing the TeamCity Azure plugin

First things first, of course. The TeamCity Azure plugin is not bundled and therefore has to be installed on our TeamCity server. It is compatible with TeamCity 8.1 and the EAP of TeamCity 9. Shutdown the TeamCity server, download the latest version of the plugin from our build server and copy the downloaded zip archive to the <TeamCity Data Directory>/plugins directory. Next, start the TeamCity server again and verify the plugin was loaded correctly from the Administration | Plugins List page.

Plugins List

Once that’s done, we can get started with creating a virtual machine or virtual machine image for our build farm.

Preparing a Virtual Machine (Image) with TeamCity Agent

We’ll need to create a virtual machine (image) on which our builds will run. In short, we need to create a Windows or Linux virtual machine:

  • on which all build prerequisites are installed (e.g. Java, .NET, Visual Studio SDK’s, …).
    Tip: When you plan on testing this plugin for .NET builds and have an MSDN-enabled Azure subscription, this is a step that can be quickly done by creating a virtual machine from a readily-available Visual Studio image.
    Visual Studio MSDN image on Azure
  • on which a TeamCity build agent is installed and configured.
  • on which we’ve opened port 9090 (or a port range in case we want to have TeamCity create virtual machines for us) in the operating system firewall and as an endpoint on the Azure load balancer. This is required to enable two-way communication between TeamCity server and the agent.
  • with which we have tested the connection between the TeamCity server and the build agent.

If we want TeamCity to create virtual machines for us, we will also have to create a generalized image of he virtual machine we’ve just created. Check the full documentation for a detailed list of steps involved in creating a build agent virtual machine (image).

Configure the TeamCity Azure plugin

Once we have the plugin installed and have a virtual machine (image) our builds can run on, we can configure the TeamCity Azure plugin. From the TeamCity | Administration | Server Administration | Agent Cloud page, we can create a cloud profile with the “Azure” type.

We will need at least a name for our cloud profile. The Terminate Instance Idle Time is an important one to configure: it tells TeamCity how long an instance can be idle before it will be stopped. As Microsoft calculates costs based on the number of minutes a machine runs, it is recommended to adjust this setting according to our usual build length. This reduces the amount of time a virtual machine is running and thus, reduces the cost.

Create an Azure cloud profile

TeamCity will need two more things to be able to provision virtual machines on Azure: a management certificate and the ID of the subscription in which to deploy build agents. After downloading the publish settings, find these values in the downloaded XML files and paste them in the plugin configuration.

Clicking Add Image lets us specify the virtual machine (image) we want TeamCity to run. The TeamCity Azure plugin supports two modes of operation:

  • Start/stop, which starts and stops an existing virtual machine on demand.
  • Image-based, which creates and destroys virtual machines based on an image.

Let’s go with an image-based approach and provision up to 10 agents based on the TC-Agent image I’ve created. We have to specify the service in which we want to provision virtual machines. The service must be either empty or contain only a virtual machine deployment. It is recommended to create a new, empty service for this.

Next we can choose the VM size, as well as a username/password for the user that will be created during the provisioning process. Note that the password has to match Azure’s password requirements.

Run TeamCity agent in Azure

After adding the image and saving the cloud profile, TeamCity does a test start for them to learn about the agents configured on them. Once agents are connected, TeamCity stores their parameters to be able to correctly process build configurations-to-agents compatibility.

From now on, TeamCity will first try to start builds on regular build agents. If none are available, it will start compatible agents in Azure. We can see the running images from the Agents | Cloud page and optionally start/stop them as needed.

TeamCity agent running in Azure

Head over to the documentation for the TeamCity Azure plugin and give it a try.

Happy building in the cloud!

TeamCity 9.0 EAP3 comes with project import, favorite builds and more!

$
0
0

Hello, our dear readers! Have we got the most exciting news for you! Although it feels like we just announced opening the TeamCity 9.0. EAP, it’s almost time for the release and we are presenting TeamCity 9.0 EAP3 build 31886 today!

We promised you the ability to move projects among servers as one of the great new features of TeamCity 9.0, and in this EAP you get the feel of what it’s eventually going to be. We were contemplating on different implementation approaches, and initially considered to add the ability to export projects from a TeamCity server, but then we realized that we already have what we need in a regular backup file, so we switched to project import! Now all you need to do is create a backup file on the source server and then select projects you want to import on the target server. Read more in our Release notes.

Another useful feature of this release is favorite builds – you can now star your favorite builds and they will be listed on a dedicated page. Optionally, you can also configure notifications for your favorites.

The TeamCity web UI is getting more and more user-friendly: now you can create and modify custom charts right from the UI.

Those of you who use meta-runners will love the new option to create a build configuration from a Meta-Runner, which makes it easier to fix problems in the Meta-Runner and verify the fixes.

Among other features is the ability to compress artifacts to a 7-zip archive, new options for Perforce VCS roots, the ability to push parameters to dependent builds when using snapshot dependencies, etc.; these and about 150 fixed issues are listed in our Release notes.

Download the newest TeamCity build and give it a test-drive now! We are anxious to hear your feedback - help us to make TeamCity better!

Happy building!

TeamCity VMware vSphere plugin

$
0
0

TeamCity always aims at giving your team more build power, and for those of you taking advantage of local cloud capabilities with VMware vSphere, the new TeamCity VMware vSphere plugin will surely be an asset. With this plugin, TeamCity can start and stop TeamCity agents installed on VMware virtual machines on demand, similarly to integrations with Amazon EC2 and Azure .

TeamCity-VMware cloud agent integration requires:

  • the TeamCity VMware vSphere Cloud plugin (compatible with TeamCity 8.1+) installed on the TeamCity server;
  • a configured virtual machine with an installed TeamCity agent in your cloud set up to start the TeamCity agent on boot,
  • a configured cloud profile on the TeamCity server.

Let’s go step-by-step and set up the integration.

Install the plugin and configure the virtual machine

Since the plugin is not bundled with TeamCity, we need to install it on the TeamCity server. Next we need to create a virtual machine where our builds will run.

The virtual machine with the TeamCity agent needs to be prepared as described in our documentation; when configuring the TeamCity build agent, be sure to specify the valid TeamCity server URL in the build agent properties.

After you start the build agent, it connects to the server, and you need to authorize it in the TeamCity Web UI so that the builds can run on the agent. Please ensure that the agent that connected to the server can actually run the builds you want it to run later.

When configuration and testing is complete, power off the virtual machine. If we want TeamCity to clone this virtual machine for us, we need to create a snapshot of this virtual machine.

You can also use the machine you created to make a template, see more information in the VMware vSphere documentation.

Configure the TeamCity VMware profile

Next we need to create an agent cloud profile in TeamCity on the Administration | Agent Cloud page selecting VMware vSphere as the cloud type.

A profile name is required; it is also recommended to configure the Terminate Instance Idle Time setting which will save you the resources: it specifies the period of time for the virtual machine to run without builds after which TeamCity will stop it. You also need to provide the cloud access information, including the vCenter SDK URL and your user credentials.

You can verify your credentials using the Test connection / Fetch options button, which also refreshes the information on the virtual machines, snapshots and resources available in your cloud.
CreateCloudProfile1
Now we can add images and specify the virtual machines or templates we want TeamCity to use.

The VMware vSphere plugin can either start and stop an existing virtual machine, or clone virtual machines from snapshots deleting the clone after the machine is stopped. For templates only the clone behavior is supported.

Click Add Images and select the virtual machine and the desired behavior. For the clone behavior, select the snapshot to use, the folder for clones and the resource pool where your machine will be allocated. The maximum number of instances will limit the clones created.

In this test set up we are using the clone behavior with 2 being the maximum number of instances: TeamCity will clone a machine from the specified snapshot and will delete the cloned machine after it is stopped:
AddNewImage

When the images are added and the profile is saved, a clone is created from the snapshot. It connects to TeamCity and TeamCity processes build configurations-to-agents compatibility.

As with all cloud integrations, you can view and manually start/stop the cloud agents on the dedicated Agents| Cloud page in the Teamcity Web UI:

cloudInstancesVMware

Our integration is configured. Now when distributing queued builds, TeamCity will start a compatible agent in vSphere if required.

The agent will be authorized automatically and will start running builds. The Agents page will display the builds running on the cloned machines:

agentBuilds

Try the plugin and don’t hesitate to share your feedback with us!

Happy building!

Case study: TeamCity in Devbridge

$
0
0

This guest post is brought to you by Arunas Paskevicius, Web Developer at Devbridge Group. Based on the original CI with TeamCity Server“ post in the Devbridge blog.

Pre-TeamCity

A few years ago, most of our projects were just plain .NET web applications, and using one CI server (CruiseControl.Net) was enough. But as the company grew, so did our client base, and we realized not everyone wanted their projects to be written in C#. We started offering solutions created with PHP, NodeJS, Objective-C, Java and other languages. We also began using other tools for CI. For instance, we used Jenkins, and it ended up causing some problems.

The first problem was that some teams used CC.NET, while others used Jenkins. Sharing reusable build steps was problematic, because they were either “shell scripts” or CI application dependent configurations, not to mention we were dealing with different OS installations (Windows, Linux, OS X) on each of our CI machines.

The second problem was the usage balance between our CI machines. Some machines were used for running development and testing builds, others were used for deployment. For us, development builds occur frequently, so the machine responsible for this was always at max capacity while the production build machine wasn’t used nearly as much.

Deciding

After a frustrating time, we decided that we needed a single CI environment where we could reuse our existing CI machines. This would allow for a painless transition from other CI software.

We took Jenkins, Go CD, Atlassian Bamboo and JetBrains TeamCity and installed them on our test machine for comparison. Next, we created build configurations for already existing projects and checked for the following:

  • Simplicity of creating a build
    To move everyone from their current CI software to the new one, we wanted it to have a simple and clear way of creating builds so that the learning curve would be as low as possible.
  • Build reusability (templates, etc.)
    A lot of our projects use mostly the same build steps, so we need a way for creating templates and other ways of reusing those configurations.
  • Scalability
    We wanted our CI machines to be easily managed, added and balanced for our builds. The ability to intelligently pick the right machine for the build was necessary.
  • Active Directory support and role management
    At Devbridge Group, we use Active Directory to manage user accounts, groups and permissions. The CI software that we chose had to support authorization and, if possible, groups.
  • Ease of configuration and the overall look and feel
    Using an ugly piece of software should be a thing of the past. We wanted the software to be easy to understand, aesthetically pleasing and responsive.
  • REST API
    We needed the software to have a RESTful API so that we could connect it to our other monitoring software, re-run builds and so on.

Choosing TeamCity over others

The reason we picked TeamCity was because it had the best results for our necessary requirements.

  • Simplicity of creating a build
    Creating builds in TeamCity was a breeze. TeamCity came bundled with most of the tools (runners) we needed for C# and JAVA projects. To create the build steps, we just needed to select a runner in correct order with one or two additional parameters. For PHP we just downloaded “meta runners” from the official JetBrains GitHub repository and created build steps. Additionally, we were pleased that it’s possible to create artifacts from a build and then use it as a Report page. For example, code coverage.
  • Build reusability
    TeamCity has templates that make it possible to copy build configurations from one project to another. It’s possible to create beautiful, reusable templates and add configuration parameters so that when you create a new build from the template, you can specify certain data: build.xml location, GIT tag prefix and so on.
    Another great feature is the meta-runner. It allows the user to create smaller templates for a specific sequence of build steps. For example, you can create a Heroku deployment build step sequence, then extract them all into a single runner, and use it in other templates or even share it with the world (like JetBrains did with the meta-runner power-pack).
  • Scalability
    TeamCity has agents that can be installed on different machines and will then connect to the central CI server software. The central software manages which agent will be used for each build. Additionally, you can define requirements for the agents to use. You can achieve this by using the parameters provided by each agent (you can also add your own).
    If you have more than one agent assigned, then your builds will be intelligently divided among those agents and the agents that don’t meet your requirements will be automatically skipped.
  • Active Directory support and role management
    This was the first thing we actually checked for. We were pleased to find that TeamCity supports both AD user and group synchronization. This made our lives easier because we could assign specific roles for specific groups.
    The overall user and role management is some of the best we’ve seen in CI.
  • Ease of configuration and the overall look and feel
    TeamCity has pretty simple configurations. Most of them, apart from LDAP, were done in a good-looking admin panel on the main CI server, eliminating the need to dig through a pile of XMLs or run through unclear lists of data.
  • REST API
    TeamCity comes with a REST API that is well documented and has a lot of action calls that can be used in your own software: triggering/stopping particular builds, getting build test information and event triggering a whole CI server and backup.

Half a Year with TeamCity

Since we started using TeamCity, creating and managing builds became significantly easier. We already have templates and meta-runners for creating new projects, and we are no longer divided by using separate software to achieve the same results. Additionally, we’ve eliminated the problem of having some CI machines idle while others are maxed out.

Overall, we think that TeamCity is a powerhouse that has strong features for JAVA and .NET projects. It also allows simple creation of additional runners and templates for any language and platform you might choose.

devbridgeDevbridge Group is an international software design and development company that builds comprehensive, custom solutions for enterprise mobile and web. Devbridge combines engineering expertise with elegant design aesthetic to deliver exceptional results for leaders in the manufacturing, healthcare, financial services and retail industries.
Devbridge Group produces more than 100,000 engineering hours annually, building custom cloud-based and mobile solutions. Long-term partnerships with Devbridge are built on trust and transparency. The company follows a streamlined agile process, is committed to Responsive Design, and always pursues excellence.

What’s New in TeamCity 9, Webinar recording

$
0
0

The recording of our January 21st webinar with Wes Higbee, What’s New in TeamCity 9, is available on JetBrains YouTube channel.

In this webinar, Wes goes over the new features of TeamCity 9, namely: rearranging projects with Project Import; storing settings in VCS; creating and editing Custom Charts; running builds in Cloud Agents; as well as some other improvements.

We were glad to see tons of questions from the attendees. Below are select Q&A from the webinar.

 Versioned Settings:

Q: When is this feature going to be available with Perforce?
A: We’re considering support for Subversion and Perforce, probably in 9.1, but can’t promise for now.

Q: What about TFS?
A: TFS might be supported in the future, but after Subversion and Perforce

Q: Given your VCS support priorities for new features, are Git, Mercurial and TFS your recommended VCS combinations with TeamCity?
A: Apart from storing settings in VCS, Git, Mercurial, Subversion and Perforce are all supported greatly. TFS is catching up. CVS, Vault and ClearCase support can be a bit limited.

Q: How does TC handle it if somebody corrupts the configuration in the repository?
A: If there are errors while applying changes, then TeamCity will not change project settings and will show error.

Q: Is it possible to use branches, e.g. to test a change in the build configuration before making it productive?
A: Not yet. But we definitely want to add this feature.

Q: How does the VCS know which branch to use?
A: It uses default branch specified in VCS root.

Q: If you want to revert to an earlier version, you need to find the desired version from within the version control system.  That is, there’s no GUI way to see the previous version from TeamCity perspective?
A: There is a changelog tab where you can see all the changes.

Q: What about parameters? Are they synced too? If not, the new features could replace templates, couldn’t they?
A: All the settings are synced form the VCS as if you edit the settings right in the TeamCity data directory (or change them in UI).

Q: If a have sync on the root project, are all sub-projects synced too? Is it recommended to have VCS for the sub projects, or a VCS for the root project only? Or are both recommended?
A: By default sub projects will be placed into the same version control. If you don’t want it for some projects, you can disable synchronization in them.

Project Import

Q: Can I import a TC8 backup in TC9? It would make testing easier :)
A: No, both servers should have the same version. 9.0 and 9.0.x are compatible, but 8.1 and 9.0 not.

Cloud Agents

Q: How does that work out with the licensing system? I guess the number of agents licensed its the hard limit of active agents, including from the cloud?
A: Yes. The total number of agents (real and virtual) connected at any given time should not exceed the total agent licenses limit. When there are enough agent licences, TeamCity automatically authorizes new cloud agents and unauthorizes the stopped ones.

Q: How do we create the VM image?Is a build image template available for the Azure VM image?
A: There are no templates with TeamCity agents for now

Q: Can we configure the “on-demand” agents to use the same VM with more than one agent, until that max out? i.e. 3 agents per Azure VM.
A: TeamCity assumes there is a single agent per instance. The recommended setup is to have a single agent per machine.

Q: Can the on-demand agents be used with on-premise vCenter?
A: Yes we have vSphere plugin doing the same.

Q: Does the agent spun up hang around for a while or is it immediately removed?
A: There is an idle timeout setting to shutdown the agent instance after. When stopped, the agent is deleted from TeamCity list of agents.

Q: EC2 cloud agents auto-shutdown policy is not the best it could be meaning that it doesn’t take into account that you always get charged for an hour of usage of an EC2 instance. Any plans to improve this?
A: Yes, we do have plans to adjust the shut down to the hour limit. You are welcome to vote for https://youtrack.jetbrains.com/issue/TW-9680.

Custom Charts

Q: Is it possible to have time instead of build number on the X axis?
A: No, this is not possible

Q: I have a configuration that has different snapshot dependencies, is there any way to show the build time from beginning to end, meaning when the first dependency run to the end?
A: No, statistics charts operate per build. Theoretically you can calculate this time and report it as statistic value in the last build of the chain.

Q: Can you export the stats data?
A: Yes, there is a “download” action on the chart. Also available via REST API.

Q: Does TeamCity have possibility to show charts with time that took to run every test?
A: On the build’s Tests tab, you can see the duration chart for each test. As well on the Test history page.


Wes McClureWes Higbee is passionate about helping companies achieve remarkable results with technology and software. He’s had extensive experience developing software and working with teams to improve how software is developed to meet business objectives. Wes launched Full City Tech to leverage his expertise to help companies rapidly deliver high quality software to delight customers. He has a strong background in using Continuous Integration with TeamCity to bring quality to the table.

Setting up TeamCity as Symbol and Source Server

$
0
0

When debugging applications with various Microsoft tools, you need to have symbol and source information, provided by the Microsoft Symbol Server and Source Server technology.

It’s been some time since we created a plugin which allows using TeamCity as a symbol and source server, and now, after some bug-fixing has been done, we decided we are ready to announce it officially.

So please welcome the TeamCity Symbol Server plugin! With just a few mouse clicks you can set up TeamCity to index the .PDB files and binaries for all your .Net applications and, once the plugin is enabled, you can easily debug applications or analyse crash dumps: your debugger will be able to automatically retrieve the required symbol files and to download the sources of the appropriate version for shared libraries referenced by you application, if, say, these modules are developed by a different team in your company and shared between several projects.

Prerequisites

To set up TeamCity as a Symbol and Source server, we assume you have the following:

  1. TeamCity server 8.0.3 or later with a project and build configuration to build your application.
  2. Debugging Tools for Windows on the agent machine(s) where your application is built (can be installed using this link).

Now all you need to do is enable the TeamCity Symbol Server plugin in TeamCity and set a number of options in your debugger.

Download and install the plugin

  1. Since the plugin is not bundled with TeamCity, download the required version from here and install the plugin as usual.
  2. Now enable the symbol server on the Administration| Integrations| Symbol Server page. You will see that it is referenced by the following URL < TEAMCITY_SERVER_URL>/app/symbols. This is the URL to be used in the Visual Studio or windbg settings.

The permissions required to access symbols and sources via the TeamCity server are default for the project developer role, and the indexed data can be accessed in both public (not requiring authorization) and authorized modes.

Tune the build configuration settings

Next we need to add the Symbol Files indexer build feature to our build configuration settings:

AddBuildFeature

Once you add the feature and save the settings, all PDB files published as build artifacts of this configuration and all related sources will be indexed.

Next let’s take a look at the files we are publishing as build artifacts. In this setup we are building an application referencing a dll and we are publishing a .zip archive which includes the application along with the PDB file and the library:

Artifacts

The plugin can handle the PDB files published separately or packed using the TeamCity artifact publishing rules.

That’s it! Now we can run the build. When the build is finished, the build log shows that source indexing was performed and symbols files signatures were collected and written to an xml file:

buildLog

The file containing symbol files signatures is published internally and is available in the TeamCity internal artifacts under .teamcity\symbols:

publishedArtifacts

Set the debugger options

Now we need to set a few options in the debugger, Visual Studio in this case:

  1. In the Debug menu, select Options and Settings, in the General section uncheck the default Enable Just My Code and Require source files to exactly match the original version options.
    If you do not have the source code on the local machine or the .pdb file does not match the source code, you can use Source Server to find and download the sources: select Enable source server support and check all the options in that section.VSDebugOptions
  2. During a debugging session in Visual Studio, the debugger automatically loads symbol files that are located in the project directory. To specify TeamCity as a symbol server, select the Symbols section on the left and add the TeamCity symbol server URL ( from the Administration| Integrations| Symbol Server page) to the list of symbol file locations.
    On the Symbols page you can also filter out or specify modules that you want the debugger to automatically load symbols for. These settings can be changed manually when you are debugging.VSSymbolSources
  3. Save your changes.

Now your debugger will load the required symbol and source files from TeamCity enabling you to successfully debug applications and crash dumps!

Try out the TeamCity Symbol Server plugin and let us know what you think!

Happy building and debugging!

Benchmarking TeamCity

$
0
0

How many agents can be handled by TeamCity server?

This is our official reply to the question in the title:
The latest TeamCity version is known to work well with up to 300 build agents (300 concurrently running builds actively logging build run-time data). In synthetic tests the server was functioning OK with as many as 500 agents (the server with 8 cores, 32Gb of total memory running under Linux, and MySQL server running on a separate comparable machine).

This reply is based partly on our own experience and partly on our internal benchmarks. In this post I’ll explain what kind of benchmarks we use and will also show some of the results measured against the latest TeamCity version – 9.1.1.

We’ll start with the TeamCity architecture first: this will let us understand results better.

As you already know, TeamCity consists of a server and a number of agents. Agents run builds and send results (build log, artifacts, tests, etc.) back to the server. Most of the time the results are being sent in real time, while build is still running, which allows us to show a nice real-time progress of the build in the web interface, send notifications early, and so on.

An agent sends results to the server by the RPC protocol established over HTTP. During processing of these results, the server stores data in the build log on the file system and can also write some data into the database. For instance, all statistic values, as well as the information about tests (name, duration, status) are stored in the database.

Both the agent and the server maintain buffers for the build results data: the agent sends results to the server when the buffer becomes full, the server also processes results in packs, because it greatly improves performance. To reduce concurrency costs on the server side and in the database, all build results on the server side are processed by N worker threads, where N roughly equals to the number of cores. So even if we have 300 agents sending results at the same time, they will be processed on the server with the concurrency not greater than the number of cores.

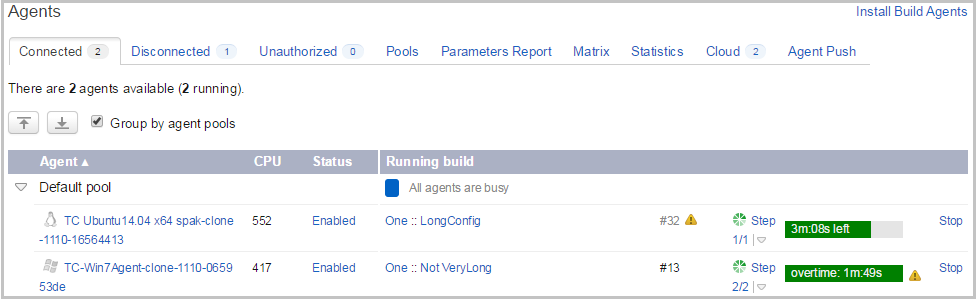
So what happens if the server cannot sustain the load? All running builds have bounded message queues, so if these queues become full because workers cannot keep up with the data from agents, agents will get blocked on an attempt to add new data from builds. As a result, the build time will start increasing. When this happens, we can observe that the build script itself has already finished on the agent, but the server still did not mark the build as finished because it is still processing the build results.

This brings us to a simple idea of the benchmark: we need to generate build logs from a lot of agents for some time with a constant rate; then we need to stop the load generator and measure the amount of build logs processed on the server up to this time. Once we know the duration of the benchmark and the rate of build log generation, we can estimate the amount of build logs which should’ve been processed. Having this delta (estimated amount – actual amount) we can judge whether the server is ok with the load or not.

Meet Benchmark plugin

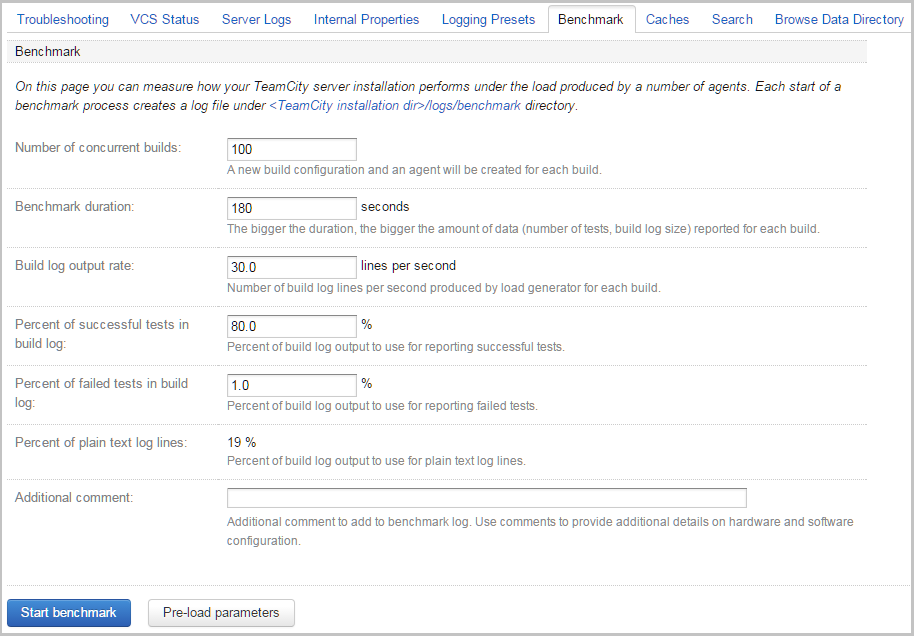
This benchmark idea has been implemented as a TeamCity plugin. The plugin adds additional tab under the Administration -> Diagnostics page. On this tab you can configure benchmark parameters, such as: the number of concurrently running builds, the duration of benchmark, the build log output rate and others.

BenchmarkPlugin3

Some of the fields require additional explanation:

  • Build log output rate – the number of log lines produced by a build per second
  • Percent of successful tests in build log – assuming that one line of the build log represents a test, this is the percent of build log lines to allocate for tests reporting. So if the build log output rate is set to 30 lines per second, and the percent of successful tests is set to 50, then the load generator will produce 15 tests per second and 15 other random log lines for each build.
  • Percent of failed tests in build log – the meaning is the same as with the successful tests percent; note that the sum of and cannot exceed 100.

Note that the build log output rate and percent of successful and failed tests can be pre-calculated based on builds history of projects already configured on the TeamCity server (see “Pre-load parameters” button).

The benchmark workflow is pretty simple. When the benchmark starts, it:

  • creates a dedicated agents pool named Benchmark with the number of agents equal to the number of configured concurrently running builds
  • creates a project with build configurations where builds will start: one configuration for each build
  • adds all builds to the queue and waits till builds start
  • spawns the load generator as a separate java process and waits till it finishes
  • cleans up the data: stops builds, removes the project and build configurations, removes the agents and the agent pool; cleanup is also performed if the benchmark is interrupted using the Stop button.

The log file for each benchmark is stored in a separate file under the <TeamCity logs directory>/benchmark folder. If additional comments are specified, they will be stored in the benchmark log as well.

Benchmark results

So we’ve done some measurements on our own hardware:
TeamCity server:

  • CPU: Core i7-4790, 3.6GHz
  • RAM: 32Gb
  • SSD: Intel 530, 240Gb
  • HDD: Seagate Barracuda ES (ST3500320NS), 7200RPM

Database server:

  • CPU: Core i7-4790, 3.6GHz
  • RAM: 32Gb
  • SSD: Intel 530, 240Gb
  • HDD1: Western Digital Velociraptor (WD3000HLFS), 10000RPM
  • HDD2: Western Digital Caviar Blue (WD6400AAKS), 7200RPM

Ubuntu 14.0.4 was installed on both servers. In case of the TeamCity server, the TeamCity data directory was placed on an HDD. On the database server, the data files and transaction logs were placed on an SSD. In all of the cases the Ext4 file system was used.

Percona server 5.6.25 was installed on the database server machine. We’ve selected Percona because it is well known for it’s performance optimizations compared to regular MySQL. The following parameters were changed in my.cnf file:

innodb_buffer_pool_size=10G
innodb_buffer_pool_instances=8
innodb_file_per_table=1
innodb_flush_log_at_trx_commit=0
innodb_log_file_size=512M
innodb_log_files_in_group=3
thread_handling=pool-of-threads # Percona and MariaDB only

TeamCity server was started under Java 1.8.0_45 with Xmx set to 3Gb.

To make the benchmark results more realistic, we set up a few open source projects and measured their build log output rate using the “Pre-load parameters” feature. See the results below:

Project name Build log output rate per build Percent of build log used by successful tests Resulting tests rate per build
commons-math 71 lines/sec 80% 57 tests/sec
JUnit 46 lines/sec 61% 28 tests/sec
Maven 45 lines/sec 28% 12.6 tests/sec
Spring Framework 20 lines/sec 50% 10 tests/sec
Netty 30 lines/sec 21% 6.3 tests/sec
Hibernate ORM 60 lines/sec 5% 3 tests/sec

Let’s see how these numbers are calculated:

  • build log output rate = <total number of log lines> / <build duration>
  • tests rate – assuming that each test is represented in the build log by at least one line:
    tests rate = <build log output rate> * <number of tests> / <total number of log lines>

As you can see, these formulas do not take the test duration into account. So even if there are lots of fast tests with the duration of 1ms, but besides running tests a build also performs other time consuming tasks, the resulting tests rate will be far from 1000 per second. This is especially true when many builds are running concurrently on the real server. In this case the builds will be in different states: some can run tests, others download artifacts, compile code, etc, etc. So we can safely say that it is unlikely that there will be a situation when all of them report tests with the rate of 1000 per second at the same time. As a result, the real load which can be sustained by the server is much bigger than one would expect by simply looking at the duration of individual tests.

Final results

For each of these projects we measured the maximum number of concurrently running builds our system can sustain without significant increase of the build duration (10% increase in build duration was considered acceptable). See the results below:

Project name Max number of concurrently running builds CPU usage (server/database)
commons-math 320 42% / 20%
JUnit 570 40% / 18%
Maven 990 50% / 15%
Spring Framework 1300 52% / 15%
Netty 1600 58% / 10%
Hibernate ORM 1650 60% / 9%

Some observations:

  • even with this hardware which is not quite optimal for the server tasks, some very promising results can be achieved
  • the more tests produced by the build per second, the smaller the resulting number of agents concurrently running builds; in our case commons-math has rate of 57 tests per second which may not sound like a lot, but surprisingly the majority of projects have much lower rate of tests. In general, the bigger the project, the slower its tests, which is understandable, as besides tests, build scripts also perform lots of other time-consuming tasks
  • the bigger the rate of the build log output, the bigger the load produced on the TeamCity server machine; with the large number of agents, the CPU usage on the TeamCity server machine reached 60%; obviously, it is not a good idea to dedicate 60% of CPU just to process data from agents as there are other CPU intensive tasks which should be done by TeamCity server
  • the load generator worked as a separate java process, and at peak times it took some CPU as well, although this time was negligible comparing to the CPU time used by the server
  • the CPU usage on the database server only reached 20% which probably can be explained by a very simple workload imposed by our test – mostly inserts, no complex queries at all

Note that the results of this benchmark cannot be applied blindly simply because this benchmark is a synthetic test and, like many other synthetic tests, it does not entirely represent the real life. For now it only measures one aspect of the server performance. It does not cover things like artifacts downloading and publishing, user requests, VCS operations, etc, etc.

On the other hand, if you plan to move your server to new hardware, this benchmark can help you to tune the hardware, disks and database parameters to achieve better performance.

How to run benchmark on your own server

The Benchmark plugin is available for download.

The plugin is compatible with TeamCity 9.1.x.

If you want to try this plugin on your hardware, please read our suggestions below.

The plugin creates agents and each agent needs to be authorized, which means you should have enough agents licenses to run benchmarks. Besides, using this plugin on the production server may be a tempting idea, but the plugin can impose a significant load on the system, making it hard to use by other users. Moreover, in case of bugs in the plugin or server crashes, you can end up with lots of data which was not properly cleaned up – agents pool, agents, projects, etc. Finally, it may not be easy to fine tune the production system for better results as it requires downtime.

Because of that we recommend to setup a separate server, obtain an evaluation license from our site to be able to run the server with unlimited agents, and then run benchmarks on this system. Note that using the latest TeamCity version is also recommended as it may have significant performance improvements comparing to the version you’re using now.

Take a look at our documentation if you’re going to use MySQL or PostgreSQL database.

We would not recommend using HSQLDB for this benchmark: since we don’t recommend this database for production use, benchmarking against it is pointless. It’s a good database engine, but it is not as reliable and scalable as “big” databases. Big databases implement sophisticated approaches to keep your data safe (see for example: http://www.postgresql.org/docs/current/static/wal-reliability.html or https://www.percona.com/blog/2006/08/04/innodb-double-write/). HSQLDB being a database written in Java does not have a chance to implement similar reliability as it does not have proper access to hardware.

While running benchmarks, make sure to run them a few times, or at least run them with the duration not less than 180 seconds as this makes results more predictable. It is also recommended to perform a few warm up benchmarks after the server startup. Finally, if you choose to tune some parameters in the database or elsewhere, make sure to change one parameter at a time. Otherwise you may fail to notice which parameters give you better results.
Benchmarking is fun, but be prepared to spend tons of time on it!

We hope that you will use this plugin to assess your server performance, so if you do decide to run this benchmark, we will be really interested in seeing your results.

Happy benchmarking and building!

TeamCity Hub plugin

$
0
0

Greetings, everyone!

Today we are releasing the first version of the plugin for TeamCity which provides integration with JetBrains Hub, a single point of entry for user management across all JetBrains team tools.

The first version of the Hub plugin for TeamCity handles authentication via Hub and user details synchronization; so if you are already using Hub, install our plugin to enable single sign-on (SSO) and to automatically update user details from Hub in TeamCity.

The current plugin version is compatible with TeamCity 9.1.x and Hub 1.0.

Download hub-plugin.zip from here and install it on your TeamCity server as usual. After the server restart, the integration can be managed using the Administration | Hub Settings page.

Please refer to the documentation for the usage details.

We keep working on the TeamCity-Hub integration, and your feedback is greatly appreciated!

Happy connecting and building!

TeamCity Take on Build Pipelines

$
0
0

Although it is possible to setup  build pipelines in TeamCity, you will not find the term “build pipeline” in the TeamCity web interface or even in our documentation. The reason is that we have our own term: “build chain“, which we feel describes TeamCity’s build-pipeline-related features better.

First of all, while the word “pipeline” does not impose sequential execution, it still implies it. At the same time, in TeamCity a build chain is a DAG – directed acyclic graph, and as such a traditional build pipeline is just a special case of the TeamCity build chain. But there are other differences as well.

Source code consistency

Source code consistency implies that all builds of a build pipeline will use the same source code revision. Traditionally, when build pipelines are described, not much attention is paid to this problem. After all, if someone needs consistency, it can be achieved by sharing data between builds using a file system or by tagging the source code in the repository and then fetching the same tag in all builds.

But from our experience in the majority of cases users need consistency for all of the builds participating in the pipeline. For instance, if you build parts of your project on different machines in parallel and then combine them in the last build, you must be sure that all of the parts have used the same source code. Actually, any time when you need to combine results of execution of several parallel builds, you need to be sure all these builds have used the same source code.

You can spend time and achieve this consistency somehow via build scripts, but since many developers face the same problem, obviously this is the area where CI tools should help. TeamCity provides source code consistency for all builds in the chain automatically. It does it even if the build chain uses different repositories and even if the builds use repositories of different types – Git, HG, SVN, Perforce, TFS.

Triggering

We also thought that traditional approach to triggering – when the next build of the pipeline is triggered after the previous one is finished –  is limiting, especially in terms of optimizations that CI system are capable of. If the whole build pipeline is known from the beginning, then it is possible to reduce build time by making some optimizations. But if the builds in the pipeline are triggered one by one, then it will always take the same time to finish completely.

For instance, say we have a pipeline C -> B -> A, where C is the first build and A is the last:

cba_chain

If we trigger the whole pipeline at once, all builds (C, B and A) will be added into the queue and, if the system already has a finished build which used the same source code revision as build C will, the build in the queue can be substituted with such finished build reducing the total build time of the pipeline. This is exactly what TeamCity does for all build chains while they sit in the queue.

But if we trigger the builds one by one, i.e C is the first, then upon finishing C we start B, and so on, then there are much fewer opportunities for a CI system to optimize something. If something triggered C, the CI system must obey it , because this is how the user configured it. Even if there are finished builds identical to C (run on the same sources revision), at this point  the CI system cannot avoid running C, as upon finishing C, build B and eventually A must be triggered as well. If we decide to not run C,  we will not run the whole pipeline, which is definitely not what the user expects.

So this is the reason why we always recommend to avoid triggering builds one by one. If the build chain is fully automated (which is what we all try to achieve these days), then ideally there should be only one trigger – at the very last build of the chain (in terms of TeamCity – the top build, build A in the example above), which will trigger all the builds down the pipeline. Fortunately, TeamCity triggers are quite advanced, you can configure them to trigger the whole chain if a change was detected in a part of it. This has an important benefit as the set of triggers that you need to maintain can be drastically decreased.

According to the data collected from our own build server, due to this and other optimizations performed in the build queue, TeamCity greatly reduces the amount of work performed by agents daily:
queue_stats

Note that our server produces about 2500-3000 build hours per day, so if there were no optimizations like this, we’d have to add more agents, or our builds would be delayed significantly.

Data sharing

Another important aspect is how you pass data from build to build in a build chain. Obviously you can use artifacts for this task: the previous build produces artifacts and the next one uses them as input. But note that in many cases you cannot rely on the fact that the next build will be executed on the same machine as the previous one. Even if it does, a few other builds could be executed on this machine and they could remove the results that you wanted to share. Fortunately, publishing artifacts to TeamCity and then using artifact dependencies to retrieve them solves all these problems.

Besides,  in TeamCity you can also share parameters between builds. All builds in TeamCity publish their parameters upon finishing: system properties, environment variables, the parameters set in their build configuration at the moment of the build start, the parameters produced by the build with the help of service messages, etc. And all of them can be used in the subsequent builds of the build chain. For instance, this makes it possible to use the same build number for the whole build chain.

Find out more on sharing parameters.

Build pipelines view

The traditional approach to build pipelines implies that there is a dashboard showing all pipelines and changes which triggered them. Given that some of our customers have build chains consisting of hundreds of builds (we’ve seen chains with up to 400 builds) and in large projects there can be hundreds or even thousands of source code changes per day, it is obvious that a simple dashboard will not work.

TeamCity has the Build Chains tab on the build configuration level displaying an aggregated view of all of the chains where builds of this build configuration participated. It can surely be used as a dashboard to some extent, but with large build chains it quickly becomes unusable.

build_chains

Fortunately in TeamCity each build of the chain also shows the state of all of the builds it depends on. So by opening the build results of the last build in the chain (the top build) you can see the state of the whole chain: which builds are running, which builds failed, which artifacts were produced by each build, which tests failed for the whole chain, etc.

build_results_deps

Summary

Hopefully this article sheds some lights on to how build pipelines can be configured and used in TeamCity and why they work this way. To sum up:

  • a build pipeline in TeamCity is called a build chain
  • source code synchronization in TeamCity comes for free, you don’t need to do anything to achieve it
  • the data from build to build can be passed with the help of artifacts or parameters
  • if possible, avoid one-by-one triggering: the bigger the parts you trigger, the better
  • monitor the build chain results using the results page of the last build in the chain or using the Build Chains tab

AWS CodeDeploy Runner plugin

$
0
0

Good news for those of you who use both TeamCity and Amazon Web Services, and those who for now stick with only one of the above, but are looking for a good integration.

With the help of the new TeamCity AWS CodeDeploy Runner plugin, your application can now be automatically deployed directly to your fleet of EC2 instances, on-premises instances or both in the scope of the CodeDeploy application.

AWS CodeDeploy is a fully managed, high-scale deployment service that can work with any kind of deployable content like code, web and configuration files, executables, etc. and with almost any kind of target platforms.

Generally, any deployment consists of four main steps:

  • preparing deployable content
  • uploading it to a repository
  • triggering a deployment
  • viewing the deployment status

TeamCity AWS CodeDeploy Runner plugin helps to automate and simplify all the mentioned tasks by adding a build step which packages the build output as a revision, uploads it to an S3 bucket and registers it in CodeDeploy. For the registered revision, it can run a deployment and optionally monitor and show its status using the TeamCity progress and error reporting.

To set up a deployment, one basically needs to make the following five steps (assuming  the initial account set-up is complete):

  • set up target instances
  • plan a revision
  • set up a CodeDeploy application
  • add an AWS CodeDeploy step to a TeamCity build

Target instances

By default each deployment can target up to 50 instances which must be running an AWS CodeDeploy agent and either be tagged or belong to an Auto Scaling group. Amazon EC2 instances must be running with an IAM instance profile attached –  for the AWS CodeDeploy agent to verify the identity of the instance – and must belong to the same region as the CodeDeploy application.

AWS CloudFormation provides a template which creates and configures new, single Amazon EC2 instances based on Amazon Linux or Windows Server with the AWS CodeDeploy agent already installed. For more information on setting up both EC2 and on-premises instances, see Configure Instances.

Application revision

An application revision is an archive containing deployable files accompanied by the application specification file appspec.yml which is a YAML-formatted file used by CodeDeploy to determine where to place the application files on the target instance, and which lifecycle event hooks to run in response to deployment lifecycle events – that’s where most of the magic happens. The archive is uploaded to an existing S3 bucket and registered in a CodeDeploy application.

The TeamCity AWS CodeDeploy Runner accepts either a ready-made application revision (must contain appspec.yml) archive or a list of paths to package. For the latter Ant-style wildcards like dir/**/*.html are supported.

CodeDeploy application

A CodeDeploy application is a place where all the deployment resources are put together: the revision location, deployment group, deployment configuration and other settings.

An AWS CodeDeploy deployment group identifies a collection of instances based on their tags, Auto Scaling group names, or both. Multiple application revisions can be deployed to the same instance, and one and the same application revision can be deployed to multiple instances.

The deployment configuration specifies a set of deployment order rules and the success and failure conditions. It specifies the number (or percentage) of instances that must remain available at any time during a deployment. One may either use one of the default configurations, or create a custom one.

AWS CodeDeploy TeamCity build step

After one has a working CodeDeploy application,  he or she only needs to type in the settings such as  region, credentials, S3 bucket parameters, CodeDeploy application and deployment group name, and run a TeamCity build.

Screen Shot 2016-03-17 at 17.32.35

TeamCity brings Azure Resource Manager support

$
0
0

arm-logo

Microsoft has recently introduced a new way to deploy cloud resources, so currently there exist two Azure deployment models supported by TeamCity as two separate plugins.

The earlier Azure deployment model is in the feature freeze state and is now called Azure Classic. The same goes for the existing TeamCity Azure support, now called TeamCity Azure Classic plugin.

Azure Resource Manager is the new Azure deployment model, which has some advanced features and is now becoming popular. More and more users want to deploy cloud agents with it, so today we are glad to announce a new plugin, the Azure Resource Manager plugin for TeamCity.

Plugin Description

The plugin for TeamCity starts new cloud build agents from a generalized VHD image when all of the regular build agents are busy. It uses resource groups to deploy build agent resources and supports authentication with an Azure Active Directory (AD) application.

While starting a new virtual machine, the plugin creates a new resource group and deploys required resources into it. When a cloud agent is terminating, the resource group with the allocated resources is removed.

The latest plugin version is available for download to the TeamCity 9.1.x users as a separate plugin which can be installed manually.

Azure Authentication Settings

The plugin accesses the Azure Resource Manager by leveraging an Azure AD application. To create a new application, follow the steps described in the Azure documentation. Then open new portal, navigate to Subscriptions, select the target subscription and assign a Contributor role to your Azure AD application.

Note: To find your application, type the application name in the users search box, because originally that list contains only usernames, not applications.

Virtual Machines Preparation

The plugin supports generalized VHD images to start new TeamCity cloud build agents. Perform the steps below to prepare VHD images.

New Image Creation

Create a new virtual machine with the Resource Manager via the new portal or cli tools, and configure it properly. Then fulfill generalization according to the Azure documentation for Linux and Windows virtual machines. As a result, you will get a VHD image in your blob storage.

Migrating Specialized Classic VM Image

If you previously used a specialized image or Start/Stop behaviour for a cloud build agent, you must capture it now. To do that, prepare a virtual machine by removing temporary files and then make a new image capture. Please refer to the Azure documentation for Linux and Windows machines. Then follow the steps below to migrate a generalized classic VM image.

Migrating Generalized Classic VM Image

If you already have a generalized VHD image located in the classic storage account, just copy it to a storage account created with the Resource Manager. To do that, use Microsoft Azure Storage Explorer.

Network Settings

To start new virtual machines, ensure that you have a Virtual Network and Subnet created in the target Azure region. If you already have virtual machines deployed with the Resource Manager, you can use them; otherwise you must create a new one and configure it as follows:

  1. Open the Virtual Network creation widget on the new portal and press Create.
  2. Fill in the settings and select the Resource Group located in your target Azure region.
  3. Press Create and wait for the deployment completion.

Note: To access your virtual machines by a public IP address, please ensure that you have properly configured security group rules for your Subnet.

Configuring Agent Cloud Profile in TeamCity

Open TeamCity Agent Cloud configuration and create a new Azure Resource Manager profile. Fill in the AD application credentials from the classic portal: copy the tenant id, client id values, and create a new client secret. Then select your subscription and target region to deploy new TeamCity build agent resources:

arm-credentials

Configuring Build Agent Images

Then add a new agent image in the cloud profile by pressing the Add image button and set configuration parameters:

arm-image

Source image is a VHD blob URL of generalized Virtual Machine. Please note that currently the Azure Resource Manager allows creating OS disk images only in the original storage account where the source VHD image is stored. More details are available in the Azure forum request.

Name prefix will be used as a prefix for the resource group name. Note that you must use unique prefixes within your subscription.

Network settings allow using the preliminary created virtual networks in your target location and optionally creating a public IP address for build agent machines.

After the image is added and the cloud profile is saved, TeamCity does a test start for virtual agents to gather the agent configuration. Once the agents are connected, TeamCity stores their parameters to be able to correctly process build configurations-to-agents compatibility.

Feedback

You are welcome to try the plugin for TeamCity, and your feedback will be really appreciated, so please share your thoughts in the comments to this blog post, in the forum or issue tracker.

Happy building in the cloud!


TeamCity on Docker Hub – it’s official now!

$
0
0

As the popularity of Docker is growing exponentially, Docker Hub has become a huge software distribution platform. Users publish their own images, companies start their official repositories, and everyone is happy.

Up until now JetBrains wasn’t part of this. Then we noticed over 300 images related to TeamCity server, created by enthusiastic Docker Hub users. We decided to join the club and make support for this platform official.

We’ve published the latest version of our software as ready-to-use images and we are going to keep them updated as soon as new versions appear.

There are currently three official TeamCity images in Docker Hub:
1. jetbrains/teamcity-server
Use this image to run a fully functional, ready-to-use TeamCity server. There are multiple options and additional parameters available, which are summarized in the image description on its Docker Hub page.

Once the server is running, you will definitely need some build agents to do the actual work (building) for you. We’ve prepared two separate images for that.

2. jetbrains/teamcity-agent
This image is recommended for general Java development. Build agents created from this image will support agent-side checkout for Git, Mercurial, and SVN, any Java-related activity (as we provide OpenJDK installed), and a full set of features related to Java development.

3. jetbrains/teamcity-minimal-agent
As the requirements for build agents vary considerably, we have also created this minimalistic agent image which you can use for simple builds or as a base for your own images.

Take a look at the official JetBrains Docker Hub page for more details about our Docker images. Give them a try and let us know what you think!

Installing GitHub Webhooks from TeamCity

$
0
0

Greetings, everyone!

Since TeamCity 10.0 it has become possible to use commit hooks with a TeamCity server. Now, when a VCS change is detected via a commit hook, TeamCity automatically increases the VCS repository polling interval, reducing the load on both the TeamCity server and VCS repository. And obviously the presence of the hook greatly decreases the time needed to detect a change.

Unfortunately, installation and configuration of commit hooks is not an easy task and for on-premises VCS repositories it requires administration skills. At the same time, popular VCS hostings such as GitHub, support installation of commit hooks via their REST API, and installation of commit hooks for them can be a lot simpler, provided that we use such an API from TeamCity…

So today, we’d like to announce one more TeamCity plugin whose task is to install and maintain GitHub commit hooks (do not worry, we plan to add support for other VCS hosting services too).

The plugin supports both GitHub.com and GitHub Enterprise. The plugin does not install a webhook automatically for GitHub.com because a webhook requires a connection from GitHub.com to the TeamCity server, and in the majority of cases, when TeamCity is installed in the intranet, such a connection is blocked by a firewall. In case of GitHub Enterprise, the plugin will install a webhook automatically for any TeamCity project created from a URL or via GitHub integration.

The plugin works with the GitHub REST API and has to make API calls to GitHub on behalf of the current user, so it requires a GitHub connection configured in the project or its parent.

The plugin is quite simple, basically it does three things:

  • It shows a suggestion to install a GitHub webhook if it finds a GitHub repository in a project without such a webhook:webhook_suggestion
  • It provides a new action in the project actions menu for webhook installation enabling you to install or reinstall a webhook at any time: project_actions
  • It checks the status of all of the installed webhooks and raises a warning via the health report if some problem is detected:webhook_problem

The plugin is open source, distributed under the Apache 2.0 license. Most of the code is written in Kotlin. The source code is published on GitHub.

The plugin relies on the new TeamCity API and will only work with TeamCity 10.0 and later. Download the plugin, install it on your TeamCity server and try the plugin. We’ll appreciate your feedback!

Happy building!

TeamCity 10 GitHub-Related Improvements

$
0
0

Configuring TeamCity to use GitHub as the source code repository has always been easy, especially since the feature ‘create from URL‘ was first introduced. TeamCity 10 has brought a number of improvements related to integration with GitHub, which are worth a special mention.

Project-level GitHub Connection in TeamCity

We’ve been gradually improving the integration, and in TeamCity 10 you can now set up a connection to GitHub on the project level:

connectionproject

Once the connection is set up, you can create a project or a build configuration pointing to a GitHub repository:connectionprojectlist

Besides, with the connection configured, a small GitHub icon becomes active in several places where a repository URL can be specified: create project from URL, create Git VCS root, GitHub issue tracker, create create VCS root from URL:

createvcsroot

On clicking the icon, TeamCity will list GitHub repositories available to the user.

Configuring a GitHub connection is useful for the organization administrator who can create a parent project and configure a connection to GitHub there once; thus, all the TeamCity users of the organization will see a list of GitHub repositories URLs in the TeamCity Web UI. It makes setting up a subproject, a Git VCS root, or a GitHub issue tracker extremely easy.

GitHub Issue Tracker Integration in TeamCity

Built-in integration with GitHub issue tracker was also introduced in TeamCity 10. It is configured on the dedicated page of the project settings. If a project level connection to GitHub is configured, you can simply select the repository URL from the list available on clicking the GitHub icon:

tracker

If no connection is configured, the URL can be specified manually.

The rest is easy – select the type of authentication and provide the required information, tell TeamCity which strings should be recognized as references to issues: for GitHub, the regex syntax is used, e.g. #(\d+). TeamCity will resolve the issue number mentioned in a VCS comment and will display a link to this issue in the Web UI (e.g. on the Changes page, Issues tab of the build results page).

TeamCity Build Status in GitHub

Developers find it handy to view the status of their commits right in the repository. Earlier there were several external plugins allowing you to publish the TeamCity build status on GitHub, and in TeamCity 10 we delivered a bundled build feature, Commit Status Publisher, which automatically attaches the build status to your GitHub pull requests:

commitstatuspub

Besides, using the TeamCity REST API, you can publish the status icon of your TeamCity build in the README for your repository:

statuspic

TeamCity Commit Hooks

All the above-mentioned improvements are bundled with TeamCity 10, but we should also mention the TeamCity Commit Hooks Plugin, not bundled with TeamCity yet. This plugin is compatible with TeamCity 10 or later. Its task is to install webhooks for GitHub repositories specified in TeamCity VCS roots.
Installed GitHub webhooks greatly decrease the time required for TeamCity to detect a change. As an additional benefit, webhooks reduce the load on both the TeamCity server and the GitHub server.


Take the advantage of the TeamCity-GitHub improved integration and let these features make your experience of Continuous Integration & Delivery with GitHub and TeamCity nice and smooth.

Kotlin Configuration Scripts: An Introduction

$
0
0

This is a five part series on working with Kotlin to create Configuration Scripts for TeamCity.

  1. An Introduction to Configuration Scripts
  2. Working with Configuration Scripts
  3. Creating Configuration Scripts dynamically
  4. Extending the TeamCity DSL
  5. Testing Configuration Scripts

With TeamCity 10, we brought the ability to define configurations using Kotlin as opposed to using XML or the User Interface.

This provides several benefits amongst which are

  • A human-readable and editable configuration script, not relying on the user interface
  • Ability to do diffs on changes to a configuration script
  • Ability to check in your configuration scripts alongside your source code1
  • Ability to dynamically create configuration scripts, as well as test them

Why Kotlin?

You might ask why Kotlin and not some other language? For those not familiar with Kotlin, it is a statically-typed language developed by us at JetBrains and open sourced under the Apache 2 license. It targets the JVM, JavaScript (and we also have native in the works). It’s designed to be a pragmatic language that cuts down boilerplate code, remains expressive, and facilitates tooling. Kotlin provides a series of features that allow the creation of DSL’s (Domain Specific Languages) and TeamCity is a perfect fit for this purpose. Kotlin enables the benefits we’ve outlined and we’ll see.

Why not something more common such as YAML? Based on our experience, we believe that while YAML is great for the simpler setups, at some point it does fall short, and can lose clarity when it comes to defining more complex configuration scripts. We wanted to provide a solution that works for the simplest to the most demanding of scenarios, and that’s why we’ve gone with Kotlin. It’s important to understand though that we’re not providing just a DSL for creating configuration scripts. Kotlin is a programming language and as such we have the ability to write any kind of code in our configuration scripts (which, of course, like anything can be also abused). This enables many scenarios such as those we’ll see when creating dynamic configurations.

What is needed

Given Kotlin is a proper language, you might be wondering what tooling is required to edit configuration scripts. In principle any editor will do. Kotlin is built so that it can be used with any editor or IDE. In fact we ship support for not only IntelliJ IDEA (both Ultimate and the free OSS community editions), but also Eclipse and NetBeans. If Vim or another editor is your thing, you can also use that along with a command line compiler.

For the purpose of this blog post series, we’ll be using IntelliJ IDEA.

Creating a first script

While we can start with a completely blank script, the easiest way to create a Kotlin build script is to take an existing TeamCity project and either

  • Download it as a Kotlin Script
  • Enable Versioned Settings

The first is a great way to start playing with Kotlin configuration scripts and get a feel for them. The second option not only provides us with the configuration scripts checked in to source control, but it’s actually a required step for us to use Kotlin build scripts in production.

The recommended approach is to use the second option once we’re ready to enable Kotlin scripting in our projects. The first option, as mentioned, is great for discovering how things work and getting familiar with Kotlin configuration scripts.

Download Settings as a Kotlin Script

In order to see what a build configuration looks like in Kotlin, simply Edit Project Settings on the selected project and click on the Actions menu, picking the entry Download Configuration Script in Kotlin format

download-kotlin-settings

This downloads a zip file that contains a Maven project which can be obtained in IntelliJ IDEA. Note that the folder it contains is prefixed with a dot, which indicates it’s hidden under MacOS. The idea is that this folder can essentially be placed in version control at some point (TeamCity marks its configuration files as hidden).

Enable Versioned Settings

The second option, which is required for us to actually use Kotlin configuration scripts, is to enable Versioned Settings. This is done under Versioned Settings and selecting Enable, and Kotlin as the file format.

versioned-settings


As soon as we activate this, the TeamCity UI will no longer allow any changes and all the configuration will be stored in version control and modifications have to take place via the build script.

These script files will have the same folder layout as that of the downloaded zip file (first option). For instance, the following are the files checked in to version control for the Joda-Time project. We can see that once again it’s a Maven project containing a series of Kotlin files (.kt). 

Opening the script in IntelliJ IDEA

Once we have the configuration script (be it as a zip file or checked in to version control on enabled versioned settings), we can open it in IntelliJ IDEA, and Maven will pull down the correct dependencies. Our project layout should look like the one below

project-structure

Don’t feel overwhelmed by the number of files in there. In fact, TeamCity really only needs one file, which is settings.kts. Let’s examine each file in more detail.

settings.kts

kts is a Kotlin Script file, different from a Kotlin file (.kt) in that it can be run as a script. As mentioned above, all the code relevant to the TeamCity configuration could be stored in this single file, but it is divided into several files to provide a better separation of concerns.

This file contains usually two lines

settings

version indicates the TeamCity version, and project() is the main entry point to the configuration script. It represents a function call, which takes as parameter a Project, representing the entire TeamCity project.

The parameter GitExtensions.Project is an object in Kotlin. Think of objects in Kotlin as you would in JavaScript. Or to compare it to Java, they’d be a Singleton, a single instance of a Kotlin class. While Kotlin script could work with singletons, having a first-class support for objects, makes things much easier.

In this case, Project is the name of the actual object, and GitExtensions is the package name.

Project.kt

This file contains the GitExtensions.Project object, and is where all the magic happens. If you look at the script layout, it’s basically a code representation of the build steps we’re accustomed to seeing the TeamCity user interface

project

which would correspond to the following entries in the UI, in addition to VCS roots and Build Types.

settings-ui

GitExtensions_HttpsGithubComJetbrainsGitextensions.kt

This object defines the VCS root configuration. It’s important to note that we could have just placed all this information directly in the code above, as opposed to making the call vcsRoot(GitExtensions_…).  However, the advantage to doing this, as we’ll see, is not only to make the code cleaner and separate concerns, but also to provide  reusability.

vcs-settings-root

GitExtensions_Main.kt

Finally, we have the actual meat of where the build happens. This object defines the build steps, failure conditions, and everything else you’d come to expect for a build configuration in TeamCity

build-type

Summary

In this first part we’ve seen the components of a TeamCity configuration script. In the next part we’ll dive a little deeper into the DSL, modify the script, and see some of the benefits that Kotlin and IntelliJ IDEA already start providing us in terms of guidance via code assistants.

[1] While enabling version control storage for settings has been available since version 9, it was only available in XML format. TeamCity 10 brings Kotlin to this.

Kotlin Configuration Scripts: Working with Configuration Scripts

$
0
0

This is part two of the five-part series on working with Kotlin to create Configuration Scripts for TeamCity.

  1. An Introduction to Configuration Scripts
  2. Working with Configuration Scripts
  3. Creating Configuration Scripts dynamically
  4. Extending the TeamCity DSL
  5. Testing Configuration Scripts

In the first part we saw the basics of Configuration Scripts and how to get started. Now we’ll dive a little deeper into TeamCity’s DSL and see what it provides us in terms of building configuration scripts.

Examining the DSL

The DSL comes in a series of packages with the main one being the actual DSL which is contained in the configs-dsl-kotlin-{version}.jar file. Examining it, we see that it has a series of classes that describe pretty much the entire TeamCity user interface.

main-dls-package

At any time you can navigate to a definition using for instance IntelliJ IDEA, and it will prompt you to download sources or decompile.  The sources are available from the actual TeamCity server your pom.xml file points to, and they’re a great way to see all the potential of the DSL.

The entry point to a project, as we saw in the previous post, is the Project object. From here we can define all the settings such as the basic project properties, the VCS roots, build steps, etc. There are a few basic parameters that should be set:

  • Uuid: it’s the internal ID TeamCity maintains. It is unique across the server. It’s not recommended that this value be changed as TeamCity uses it internally to associate data with the project.  
  • extId: this is the user-friendly ID used in URLs, in the UI, etc. and can be changed if required.
  • parentId: represents the extId of a project where this project belongs, defaulting to the value _Root for top-level projects.
  • name: the name of the project

and optionally

  • description: description for the project

Beyond the above, everything else is pretty much optional. Of course, if that’s the only thing we define, then not much is going to happen during the build process.

Modifying the build process

The code below is an excerpt from the configuration script for the Spek project (parts of the configuration are omitted for brevity). This particular build compiles the code and runs some tests using Gradle.

steps {
   gradle {
       name = "Snapshot Build"
       tasks = "clean jar test"
       jdkHome = "%env.JDK_18_x64%"
   }
}


triggers {
   vcs {
       branchFilter = "+:<default>"
       perCheckinTriggering = true
       groupCheckinsByCommitter = true
   }
}

Let’s extend this build to add a feature to that TeamCity has, Build Files Cleaner also known as Swabra. This build features makes sure that files left by the previous build are removed before running new builds.

We can add it using the features function. As we start to type, we can see that the IDE provides us with completion:

features-completion

The features function takes in turn a series of feature functions, each of which adds a particular feature. In our case, the code we’re looking for is

features {
   feature {
       type = "swabra"
   }
}

The resulting code should look like

steps {
   gradle {
       name = "Snapshot Build"
       tasks = "clean jar test"
       useGradleWrapper = true
       enableStacktrace = true
       jdkHome = "%env.JDK_18_x64%"
   }
}

triggers {
   vcs {
       branchFilter = "+:<default>"
       perCheckinTriggering = true
       groupCheckinsByCommitter = true
   }
}

features {
   feature {
       type = "swabra"
   }
}

And this works well. The problem is that, if we want to have this feature for every build configuration, we’re going to end up repeating the code. Let’s refactor it to a better solution.

Refactoring the DSL

What we’d ideally like is to have every build configuration automatically have the Build Files Cleaner feature without having to manually add it. In order to do this, we could introduce a function that wraps every build type with this feature. In essence, instead of having the Project call

buildType(Spek_Documentation)
buildType(Spek_Publish)
buildType(Spek_BuildAndTests)

we would have it call

buildType(cleanFiles(Spek_Documentation))
buildType(cleanFiles(Spek_Publish))
buildType(cleanFiles(Spek_BuildAndTests))

For this to work, we’d need to create the following function

fun cleanFiles(buildType: BuildType): BuildType {
   buildType.features {
       feature {
           type = "swabra"
       }
   }
   return buildType
}

Which essentially takes a build type, adds a feature to it, and returns the build type. Given that Kotlin allows top-level functions (i.e. no objects or classes are required to host a function), we can place it anywhere or create a specific file to hold it.

Now let’s extend this function to allow us to pass parameters to our feature, such as the rules to use when cleaning files.

fun cleanFiles(buildType: BuildType, rules: List<String>): BuildType {
   buildType.features {
       feature {
           type = "swabra"
           param("swabra.rules", rules.joinToString("\n"))
       }
   }
   return buildType
}

We pass in a list of files which are then passed in as parameter to the feature. The joinToString function allows us to concatenate a list of strings using a specific separator, in our case the carriage return.   

We can improve the code a little so that it only adds the feature if it doesn’t already exist:

fun cleanFiles(buildType: BuildType, rules: List<String>): BuildType {
   if (buildType.features.items.find { it.type == "swabra" } == null) {
       buildType.features {
           feature {
               type = "swabra"
               param("swabra.rules", rules.joinToString("\n"))
           }
       }
   }
   return buildType
}

Generalizing feature wrappers

The above function is great in that it allows us to add a specific feature to all build configurations. What if we wanted to generalize this so that we could define the feature ourselves? We can do that by passing a block of code to our cleanFiles function, which we’ll also rename to something more generic.

fun wrapWithFeature(buildType: BuildType, featureBlock: BuildFeatures.() -> Unit): BuildType {
   buildType.features {
       featureBlock()
   }
   return buildType
}

What we’re doing here is creating what’s known as a higher-order function, a function that takes another function as  a function. In fact this is exactly what features, feature, and many of the other TeamCity DSL’s are.

One particular thing about this function, however, is that it’s taking a special function as a parameter, which is an extension function in Kotlin. When passing in this type of parameter, we refer to it as Lambdas with Receivers (i.e. there is a receiver object that the function is applied on).

This then allows us to make the calls to this function in a nice way referencing  feature directly

buildType(wrapWithFeature(Spek_BuildAndTests, {
   feature {
       type = "swabra"
   }
}))

Summary

In this post we’ve seen how we can modify TeamCity configuration scripts using the extensive  Kotlin-based DSL.  What we really have in our hands is a full programming language along with all the features and power that it provides. We can encapsulate functionality in functions to re-use, we can use higher-order functions  as well as other things that open up many possibilities.

In the next part we’ll see how to use some of this to create scripts dynamically.


Viewing all 103 articles
Browse latest View live


<script src="https://jsc.adskeeper.com/r/s/rssing.com.1596347.js" async> </script>